Next will be detailed each navigation menu section.
Most used
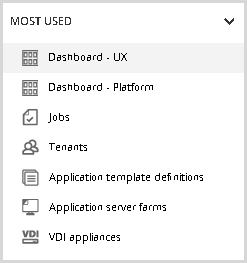
The first group of the navigation menu is always the “Most Used” group, showing the five options you mostly use and the corresponding Dashboards by role. This group is updated every time you log onto the Flexxible|SUITE.
MS Product Integration
This group shows the Microsoft Office 356 section.
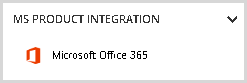
The visibility of the group and this option can change depending on the role of permissions of the logged-in user.
MICROSOFT OFFICE 365
This section allows the user to view the desktops where this product is installed. Also from this view, we can create new installations. Please refer to the Flexxible|Office 365 Deployer article for more information.
VDI OS Manager
The group shows the access to the following sections.
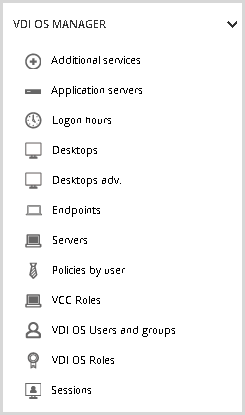
The visibility of the group and these options can change depending on the role of permissions of the logged-in user.
ADDITIONAL SERVICES
This section shows a list of additional services and allows the user to create new items.
APPLICATION SERVER
This section shows the list of application servers and a summary with information (CPU, RAM, status). Also, the user can select a desktop, perform several actions and operations, and access to the selected application server details. Please refer to the article Application Servers View for more information.
LOGON HOURS
This section shows an informative screen with the tenants logs on the information.
DESKTOPS
The desktops view shows useful information on the desktops on the infrastructure. Through this page, the user can perform on the selected desktop several actions and operations. Please refer to the Flexxible|Help Desk Tool article for more information.
DESKTOPS ADV.
The desktops advanced view shows another view of the desktops on the infrastructure, detailing advanced information for each desktop. Through this page, the user can perform on the selected desktop several actions and operations. Please refer to the Flexxible|Help Desk Tool article for more information.
ENDPOINTS
This section shows the list of available endpoints. You can access the endpoint detail from this page.
SERVERS
This section shows the list of available servers. Please refer to Server View article for more information.
POLICIES BY USER
This view shows the list of users with their policies. If you check a user, you can change their settings.
VCC ROLES
The VCC Roles view shows the infrastructure servers that are part of a deployment. Please refer to VCC Roles article for more information.
VDI OS USERS AND GROUPS
This view shows the list of users and groups with their associated tenant. You can create new users, delete or access to the edition from this page.
VDI OS ROLES
The VDI OS Roles section shows. Please refer to the Security roles and users article for more information.
SESSIONS
This section will detail the Sessions list. Please refer to Sessions view article for more information.
Accounting
This group will show the Usage log entry sections.
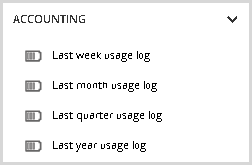
The visibility of the group and these options can change depending on the role of permissions of the logged-in user.
LAST WEEK USAGE LOG
This section will detail information about last week's usage log entry.
LAST MONTH USAGE LOG
This section will detail information about last month's usage log entry.
LAST QUARTER USAGE LOG
This section will detail information about the last quarter usage log entry.
LAST YEAR USAGE LOG
This section will detail information about last year's usage log entry.
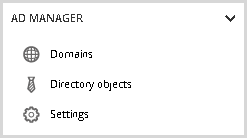
AD Manager
The AD Manager group shows access to the following sections.
The visibility of the group and these options can change depending on the role of permissions of the logged-in user.
DOMAINS
This section shows the registered domains in VDI Manager and allows to import the new client domains. Please refer to the How to set up a new domain for a specific tenant in Platinum deployments article for more information.
DIRECTORY OBJECTS
This view shows the tree of the active directory objects in the infrastructure.
SETTINGS
This settings view shows the settings related to the AD Manager.
Cleanup System
The Cleanup group shows access to the following sections.
The visibility of the group and this option can change depending on the role of permissions of the logged-in user.
SETTINGS
This settings view shows the settings related to the Cleanup System.
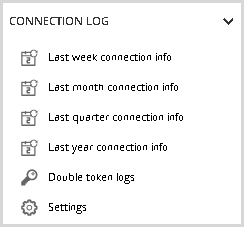
Connection Log
The Connection Log group shows access to the following sections.
The visibility of the group and this option can change depending on the role of permissions of the logged-in user.
Please refer to Connection Log for more information.
LAST WEEK CONNECTION INFO
This shows the enables connection activities in a user session for the last week.
LAST MONTH CONNECTION INFO
This shows the enables connection activities in a user session for the last month.
LAST QUARTER CONNECTION INFO
This shows the enables connection activities in a user session for the last quarter.
LAST YEAR CONNECTION INFO
This shows the enables connection activities in a user session for the last year.
SETTINGS
This settings view shows the settings related to the Connection Log.
Event Log Recollection
The Event Log Recollection group shows access to the following sections.
The visibility of the group and these options can change depending on the role of permissions of the logged-in user.
EVENT LOGS
This view shows the list of events with levels of criticality Error or Critical. Please see the Event Log Collection article for more information.
SETTINGS
This settings view shows the settings related to the Event Log Recollection.
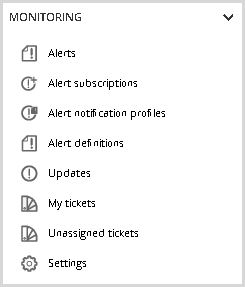
Monitoring
The Monitoring group shows access to the following sections.
The visibility of the group and these options can change depending on the role of permissions of the logged-in user.
ALERTS
This view shows the alert list defined for the infrastructure. Please refer to the Alert Configuration and Monitoring Module Overview article for more information.
ALERT SUBSCRIPTIONS
This section displayed the active subscription list and allows create a new alert subscription. Please refer to the Alert Configuration and Monitoring Module Overview article for more information.
ALERT NOTIFICATION PROFILES
This feature allows a user to set up a profile, in order to be notified about those alerts he's subscribed to. Please refer to the Alert Configuration and Monitoring Module Overview article for more information.
ALERT DEFINITIONS
If a known event type meets a monitored alarm criterion (a set of conditions or a single one) for a specified time, the system will detect it and raise the related alert. Please refer to the Alert Configuration and Monitoring Module Overview article for more information.
UPDATES
VDI Manager includes an automatic update functionality. Please see the VDI System Autoupdater article for more information.
MY TICKETS
This section shows a list of the assigned support tickets of the user logged in. You can create a new ticket from this view.
UNASSIGNED TICKETS
This section shows a list of unassigned support tickets. You can access the ticket detail from this page.
SETTINGS
This settings view shows the settings related to the Monitoring.
Reporting & Dashboards
The Reporting and Dashboard group shows access to the following sections.
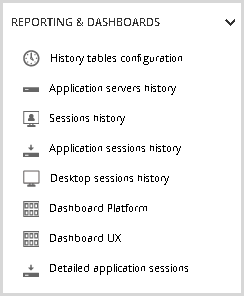
The visibility of the group and these options can change depending on the role of permissions of the logged-in user.
HISTORY TABLES CONFIGURATION
This section shows the history tables. You can access each detail and change its configuration. Please refer to the Setup and Use of Historical data article for more information.
APPLICATION SERVERS HISTORY
This view illustrates the usability of the application servers at different time intervals. Please visit the Setup and Use of Historical data article for more information.
SESSIONS HISTORY
In this section, you can see the different Pre-filtered data sources related to the sessions occurrence in the environment. Please refer to the Setup and Use of Historical data article for more information.
APPLICATION SESSIONS HISTORY
This option displays a filtered view of all the PublishedApp sessions. Please refer to the Setup and Use of Historical data article for more information.
DESKTOP SESSIONS HISTORY
This section shows the VDI sessions concurrency at different time intervals and filtered. Please refer to the Setup and Use of Historical data article for more information.
DASHBOARD PLATFORM
This section shows the Platform Dashboard. For more detail refer to Dashboard Platform and Dashboard and data analysis articles.
DASHBOARD UX
This section shows the User Experience Dashboard. For more details refer to the Dashboard UX and Dashboard and data analysis articles.
DETAILED APPLICATION SESSIONS
This section shows the Detailed application sessions. Please visit the Setup and Use of Historical data article for more information.
Scalable System
The Scalable System group shows access to the following sections.
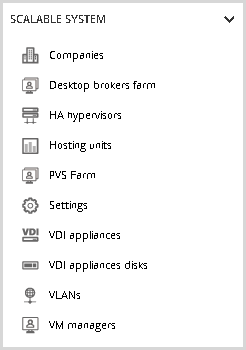
The visibility of the group and these options can change depending on the role of permissions of the logged-in user.
COMPANIES
This section shows the companies lists and allows create new companies.
DESKTOP BROKERS FARM
This section shows the desktop brokers lists and allows create new desktop broker farms. Please refer to the Desktop Broker Farm article for more information.
HA HYPERVISORS
This view shows the HA hypervisors list in the infrastructure. You can view the hypervisor detail and perform some actions in the detail view.
HOSTING UNITS
This section shows the list of hosting units and some details, like the amount of disc space used by the appliance can be seen, as well as the maximum number of virtual machines defined for the appliance. Please refer to the Capacity management for appliances article for more information.
PVS FARM
This view shows the defined PVS farms. Please refer to the How to use Citrix Provisioning Services(PVS) in Flexxible|SUITE article for more details.
SETTINGS
This settings view shows the settings related to the Scalable System.
VDI APPLIANCES
This section shows the list of VDI appliances in the infrastructure. This view allows for synchronizing of the infrastructure. Please refer to the VDI Appliances View article for more information.
VDI APPLIANCES DISKS
This section shows the list of VDI appliances disk for each related appliance.
VLANs
This view shows the VLANs list and allows create, delete, and create the VLAN in VMM.
VM MANAGERS
This section shows the VM Managers list and allows them to create a new VM Manager.
Task Orchestrator
The Scalable System group shows access to the following sections.
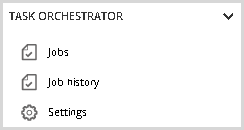
The visibility of the group and these options can change depending on the role of permissions of the logged-in user.
JOBS
This view shows the jobs view. Please refer to the Jobs article for more information.
JOB HISTORY
This view shows the job history list. Please refer to the Jobs article for more information.
SETTINGS
This settings view shows the settings related to Task Orchestrator.
Template Manager
The Template manager group shows access to the following sections.
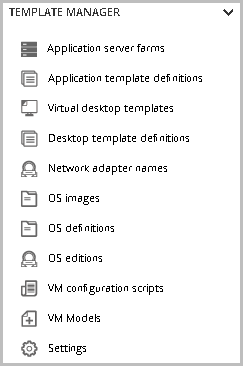
The visibility of the group and these options can change depending on the role of permissions of the logged-in user.
APPLICATION SERVER FARMS
This section shows the list of application server farms and allows the user to create a new one. Please refer to the Application server farms article for more information.
APPLICATION TEMPLATE DEFINITIONS
This is the section used to put the template in the edition or in ready for deploy status, in addition to my company section or to the detailed view of a tenant. Please refer to the Application Template Definitions article for more information.
VIRTUAL DESKTOP TEMPLATES
This section allows you to deploy new Virtual Machines over an existing template by assigning the template to new users and groups. Please refer to the Virtual Desktop Templates article for more information.
DESKTOP TEMPLATE DEFINITIONS
This view is used to put the template in the edition or in ready for deploy status, in addition to my company section or to the detailed view of a tenant. Please refer to the Desktop Template Definitions article for more information.
NETWORK ADAPTER NAMES
This section is used to create, edit, or delete the network adapters.
OS IMAGES
In this section, the customer can define various types of ISOs files to use it in the automatic generation of templates. Please refer to the OS Images article for more information.
OS DEFINITIONS
This view defines the different operating systems involved in the automatic creation of templates. Please refer to the OS Definitions article for more information.
OS EDITIONS
This view defines the different operating systems editions involved in the automatic creation of templates.
VM CONFIGURATION SCRIPTS
This section shows the set of predefined and customized scripts in the system that will be executed as part of the process of creating the templates. Please refer to the VM Configuration Scripts for more information.
VM MODELS
This view shows the list of defined VM Models. Please refer to the VM Models article for more information.
SETTINGS
This settings view shows the settings related to the Template Manager.
Tenant Manager
The Tenant manager group shows access to the following sections.
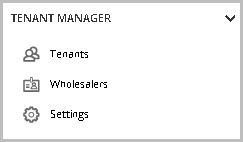
The visibility of the group and these options can change depending on the role of permissions of the logged-in user.
TENANTS
This view shows the wholesalers - Partners - Tenants structure. You can edit, create, and delete tenants from this view. For more information, you can see the Tenants View article.
WHOLESALERS
This view shows the list of defined wholesalers. You can edit, create, and delete wholesalers from this view. Please refer to How to Create a New Tenant in a Multi-Tenant Environment article for more information.
SETTINGS
This settings view shows the settings related to the Tenant Manager.
VDI Client
The VDI Client group shows access to the following sections.
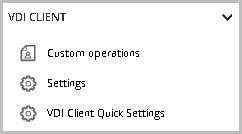
The visibility of the group and these options can change depending on the role of permissions of the logged-in user.
CUSTOM OPERATIONS
This view shows the defined custom operations. You can create, delete, or go to edit from this view. Please refer to the Custom Operation article form more information.
SETTINGS
This settings view shows the settings related to the VDI Client.
VDI CLIENT QUICK SETTINGS
This view shows the general VDI Client Quick settings for all desktops.
Web Interface
The Web Interface group shows access to the following sections.
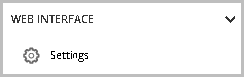
The visibility of the group and these options can change depending on the role of permissions of the logged-in user.
SETTINGS
This settings view shows the settings related to the Web Interface.
WATCHDOG
SERVICE STATUS
This section shows the list of related services and their status. You can stop VDI Manager or access to a test mail.
SETTINGS
This settings view shows the settings related to the WatchDog.