Introduction
The VDI Appliances view allows getting an overview of all the VDI appliances in the infrastructure.
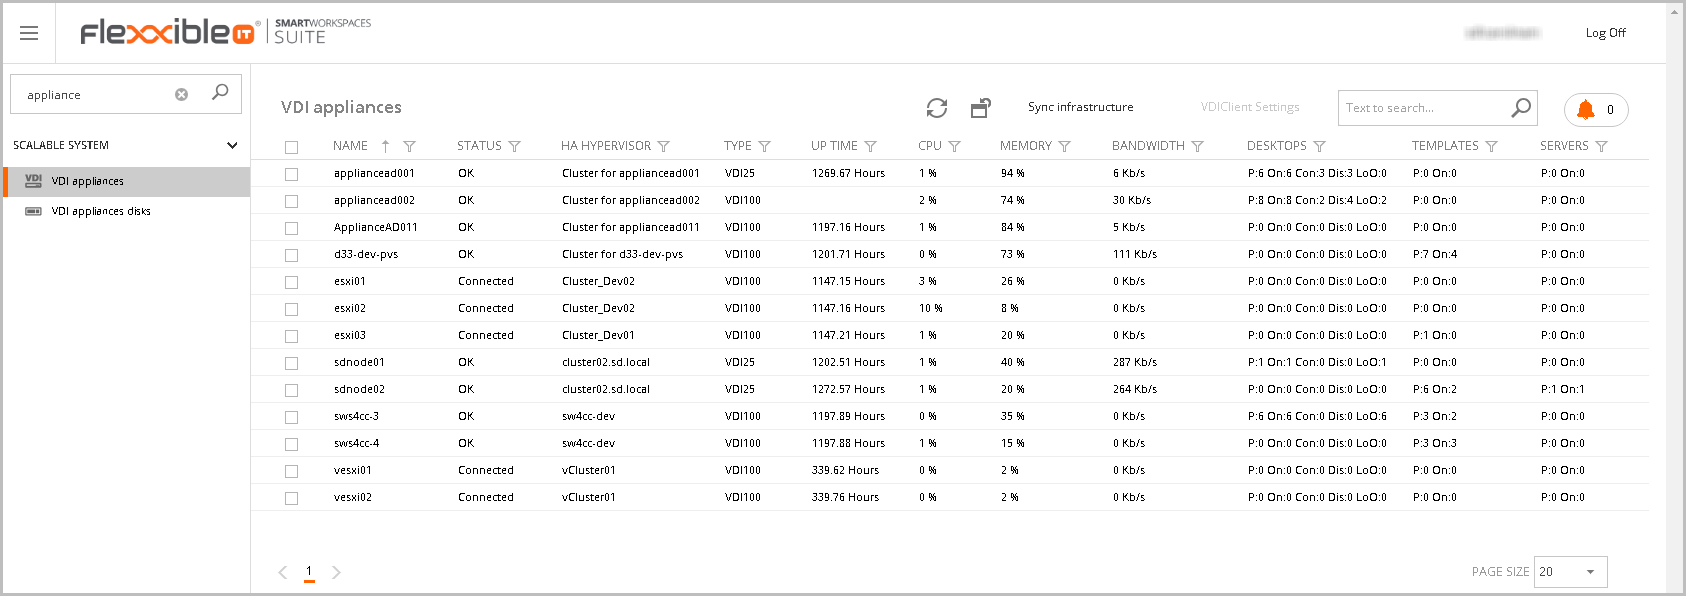
VDI appliances
The VDI appliances list shows the following information:
- Name Name of the VDI Appliance.
- Status: Status of the appliance (Connected, disconnected, ok).
- HA Hypervisor. Shows the name of the HA Hypervisor.
- Type: This shows the type of HA Hypervisor.
- Up Time: The uptime from the last restart.
- CPU: Percentage of used CPU in the appliance.
- Memory: Percentage of used Memory in the appliance.
- Bandwidth: Bandwidth in Kb/s
- Desktops: The total number of desktops and the number of desktops in "on", "connected", "disconnected" and "locked" status.
- Templates: The total number of templates and the number of templates in "on" status.
- Servers: The total number of servers and the number of servers in "on" status.
You can personalize this list as shown in the Customizing Lists and Data Export article.
The color of the text in the row can change according to the following states:
- Red: when according to VMM its overall state is different from "Ok".
- Orange: when any of the physical disks of the appliance is in a state other than OK or DORMANT.
Up to the 4.7 version, this view allows you to perform a sync infrastructure and update all the appliances infrastructure in VDI Manager. From version 4.7, this feature is available in the VCC Roles Overview view.
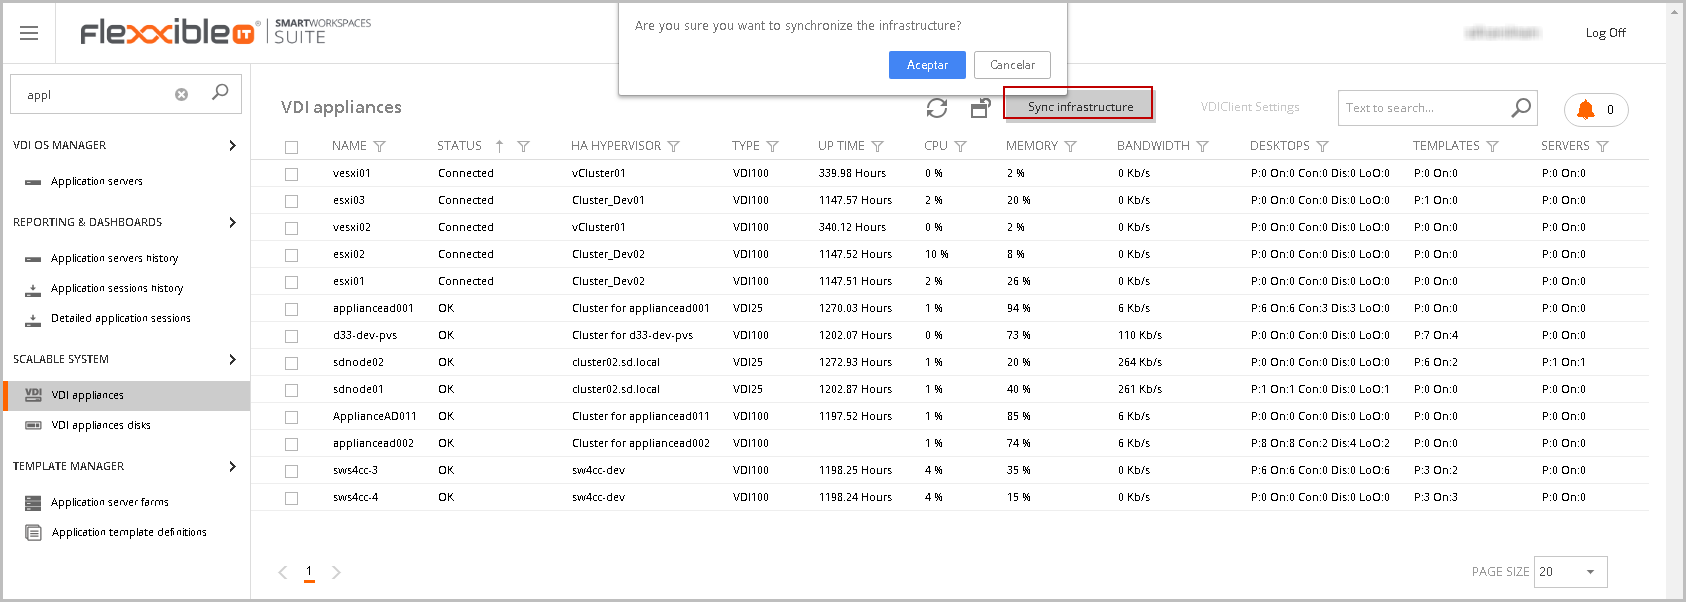
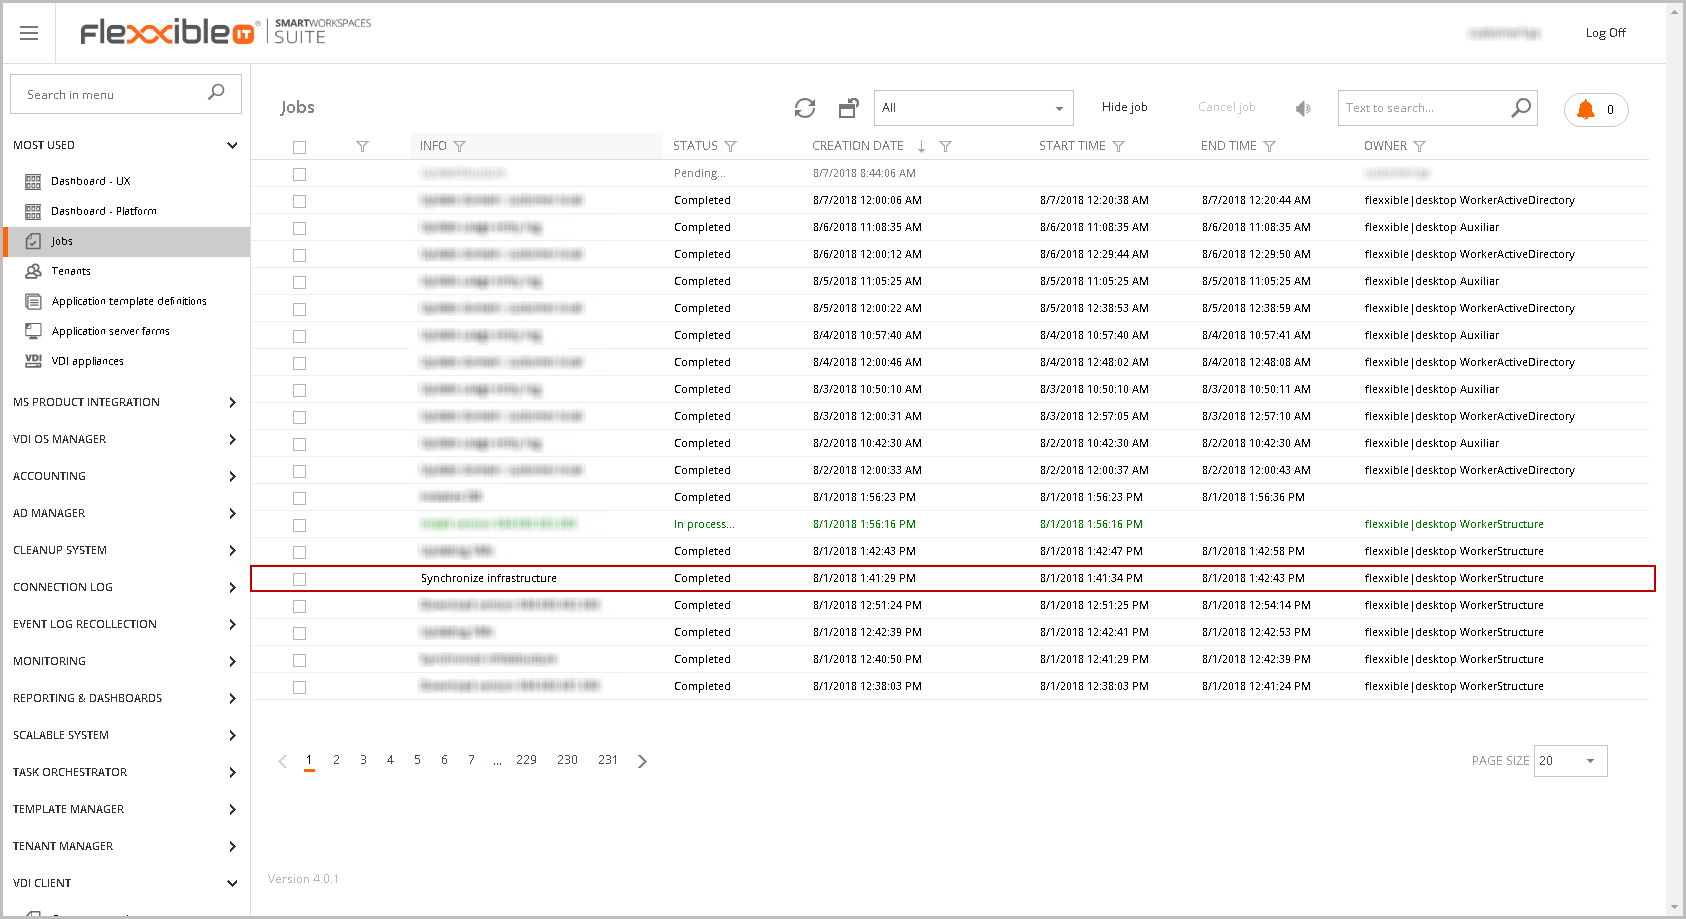
This will generate a job that will follow in the jobs section.
From version 4.7 onwards the synchronize infrastructure is available in the VCC Roles overview view.
VDI Appliance detail
The VDI Appliance detail shows important data about the selected VDI Appliance and allows to perform some actions on items stored in the appliance.
In the general section, you can see general information about the appliance, perform a power action, or update the VDIClient Settings.
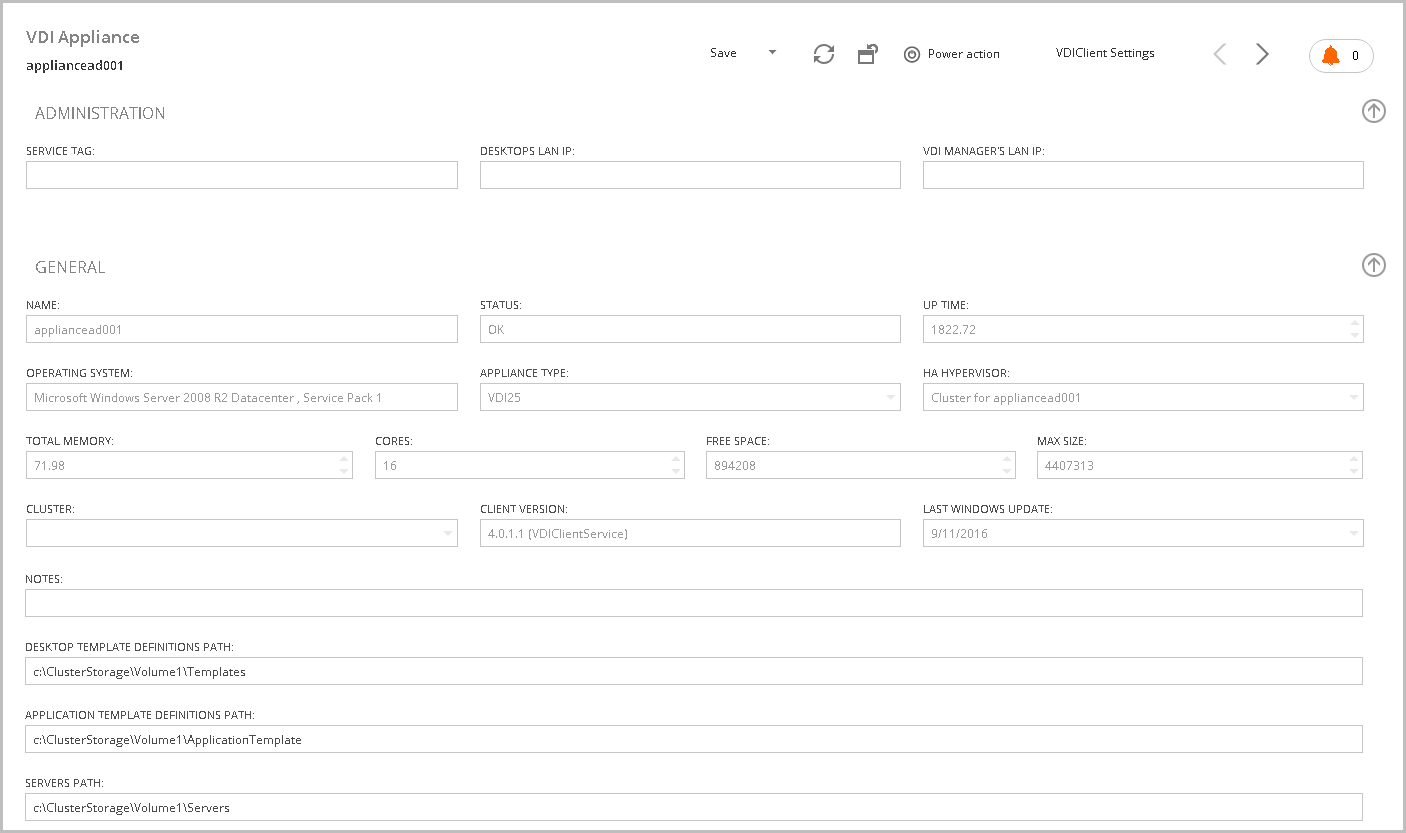
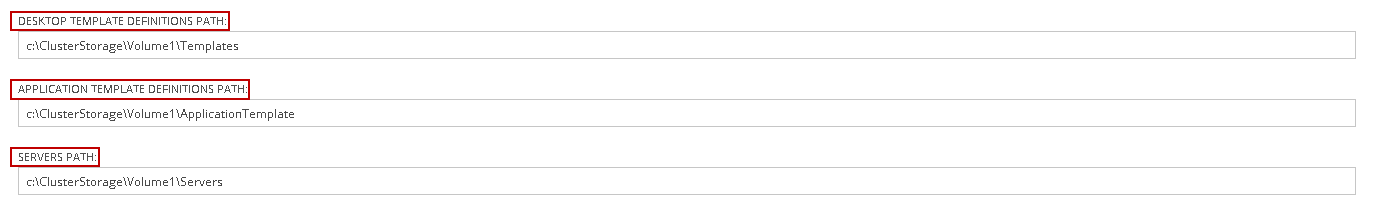
On the other hand, you must fill the paths where the desktop templates, the application templates, and the servers will be stored.
- Hyper-V
- VMware
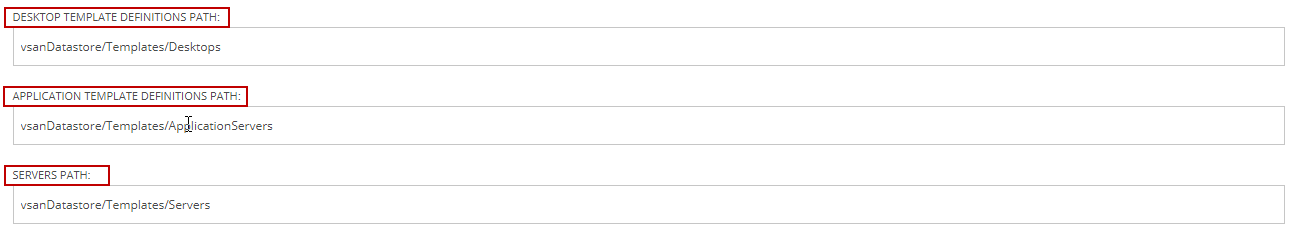
- Citrix Hypervisor
- Fill the paths with the UUID from the storage
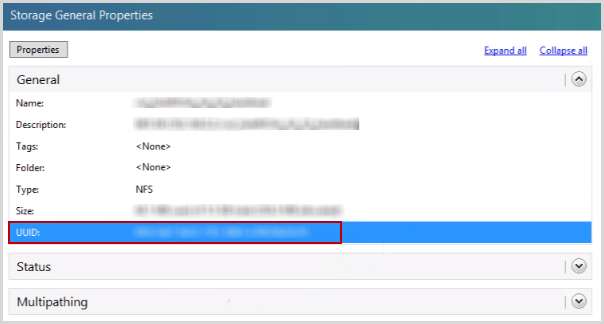
In case the storage depends on the VLAN assigned in the tenant, the value [TenantNetworkStorage] must be entered and Flexxible|SUITE will obtain the hosting units linked to the tenant's VLAN and will use its storage.
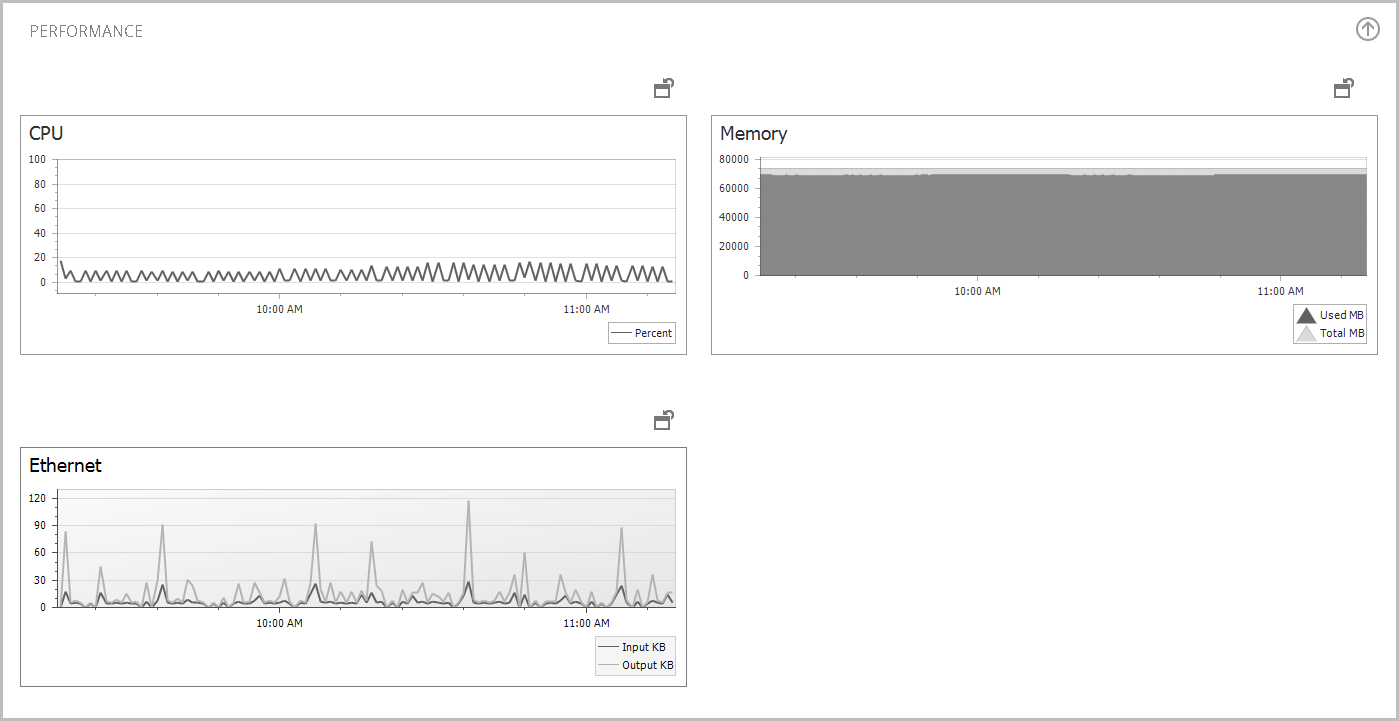
Performance
The performance graphs provide three fundamental data in the diagnosis of problems:
- CPU use: Very useful to identify defects in the sizing of the appliance.
- Memory use: Same as before.
- Ethernet: The network traffic is a very useful graph to detect anomalous behavior in the appliance.
Tabs area in the VDI Appliance view
At the bottom of the page, you can see a tabs area. In this section, you can perform other operations in any tabs.
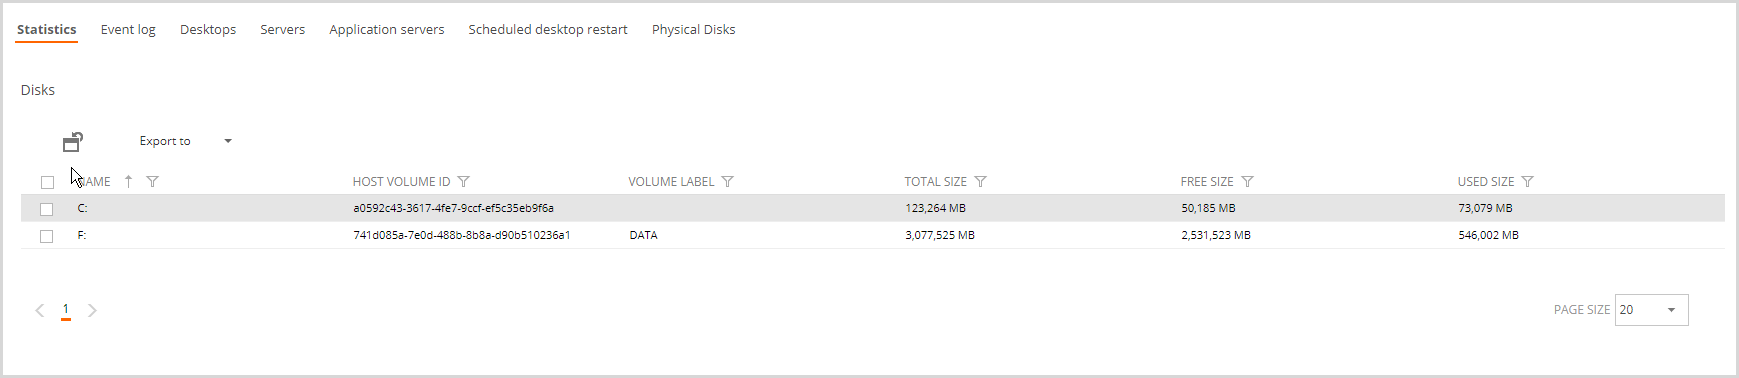
Statistics tab
The Statistics tab shows the available disks and useful information.
- Name The disk name.
- Host volume ID: The host ID.
- Volume label: The disk volume label.
- Total size: The disk total size in MB.
- Free size: The disk free size in MB.
- Used size: The disk used size in MB.
Event Log tab
The Event log tab collects the error events from desktops and infrastructure servers. Clicking you can see more detailed the event log in a modal window.
- Date: The date the event occurred.
- Type: Type of event (Information, Warning, Error, Success Audit and Failure Audit)
- Source: The source which generated the event. It could be an application or system component
- Message: The event description.
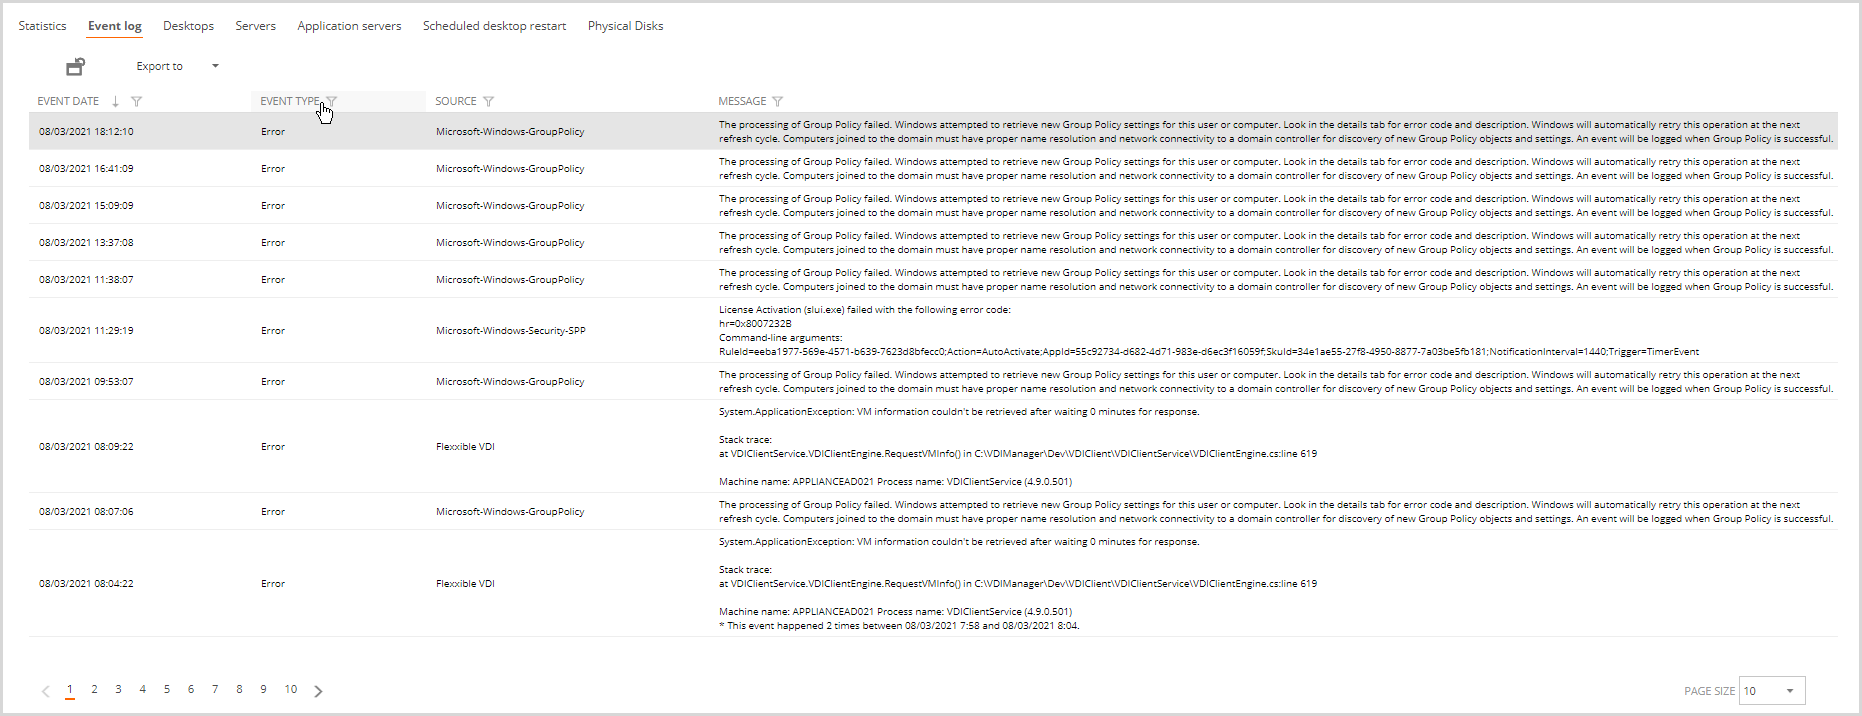
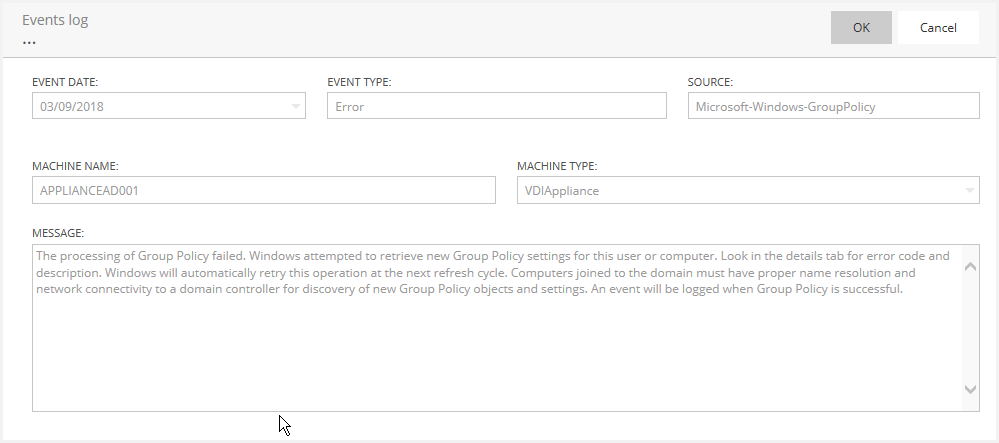
By clicking on the desired item, a modal window with more information about the selected event record is displayed.
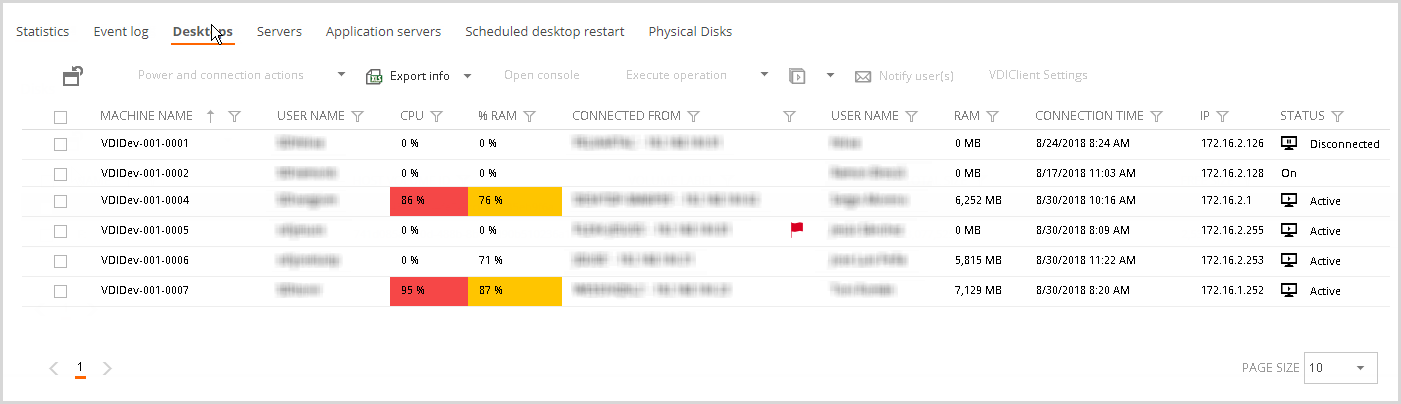
Desktops tab
The Desktops tab shows the list of available desktops in the appliance. You can perform all de operations defined in the Desktop view. For more information you can visit the article Desktop view.
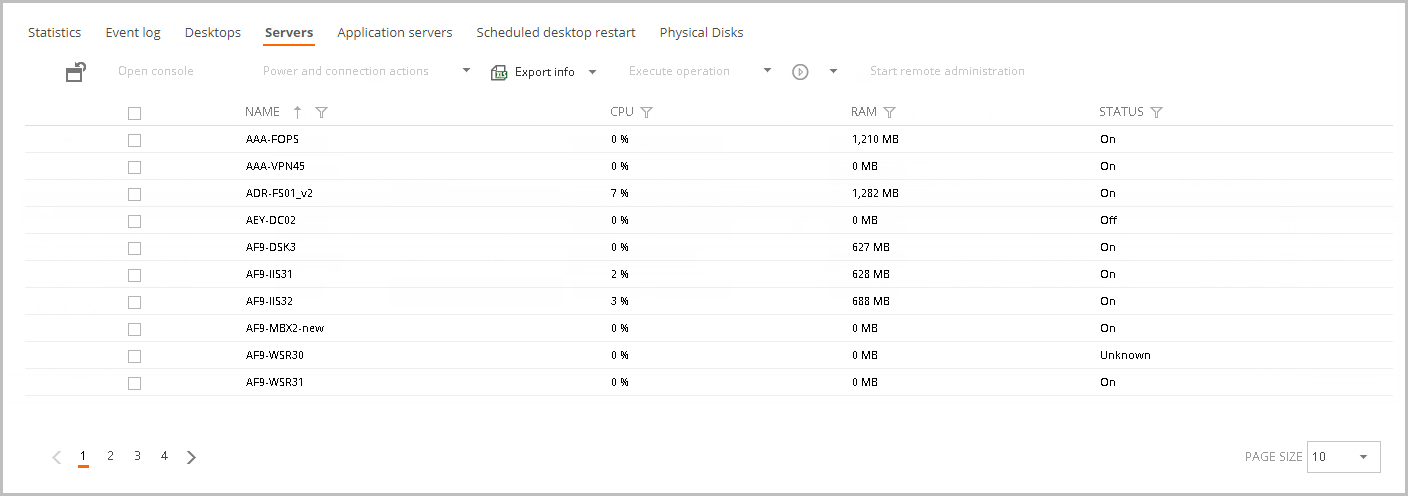
Servers tab
The Servers tab shows the list of available servers in the appliance. You can perform all de operations defined in the Server view. For more information, you can visit the article Server view.
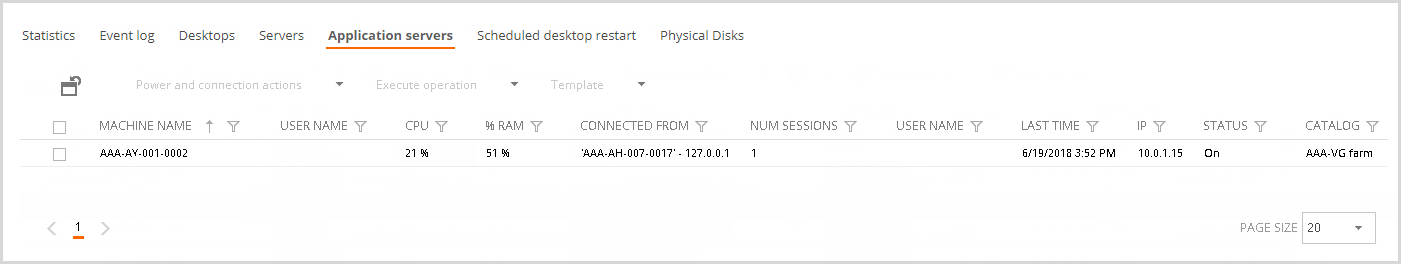
Application Servers tab
The Application Servers tab shows the list of available servers in the appliance. You can perform all de operations defined in the Application Server view. For more information, you can visit the article Application Servers view.
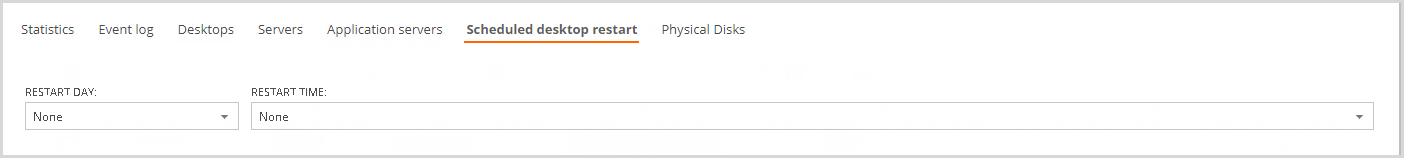
Scheduled desktop restart tab
The Scheduled desktop restart tab allows you to program a scheduled restart, setting a day of the week and a start time.
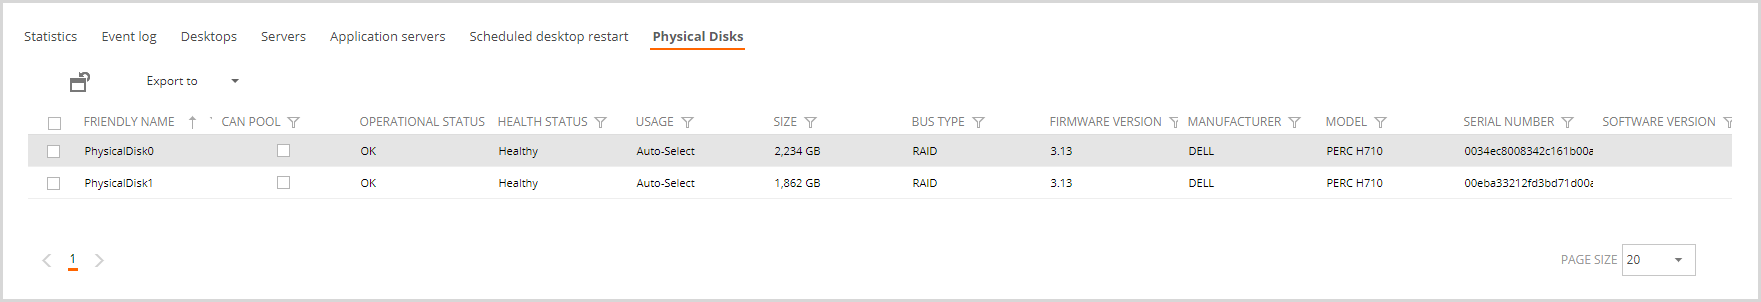
Physical Disks
The physical disks tab shows the appliances disks and their status.