The servers view allows to make an overview of all available backend servers on the infrastructure.
Servers list
This structure can group all the backend servers (fileservers, webservers, DB servers, etc.) of the client, unifying the server management in the console. In this way the user just have to access the management console.
The server list shows the following information by default:
- Tenant: The server tenant name.
- Name: The server name.
- CPU: Percentage of used CPU.
- Up Time: Number of hours since the last server restart.
- Status: The server status. Can be On or Off.
- Appliance Name: The name of the appliance where the server is stored.
- Snapshots: Number of snapshots for this server.
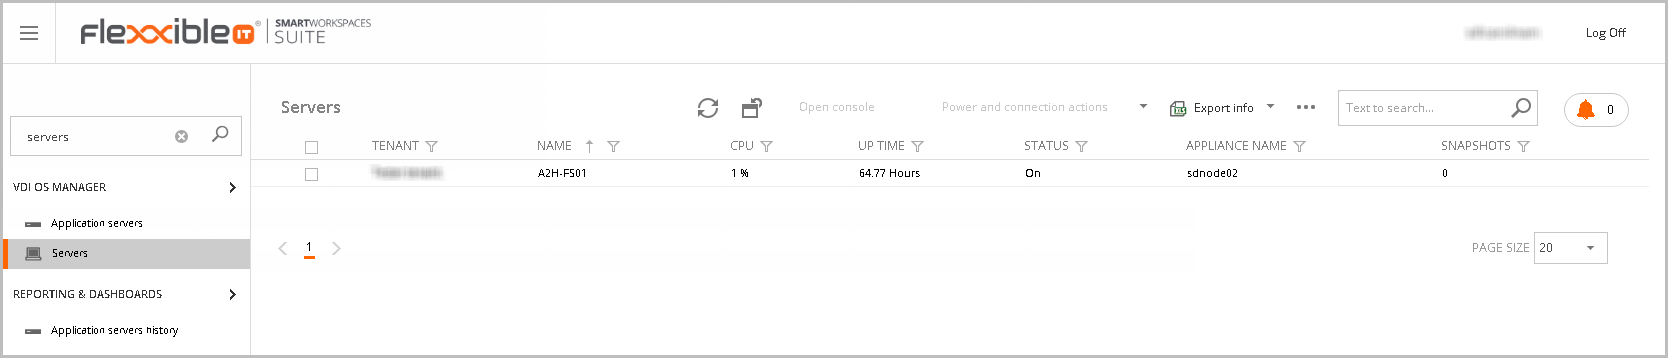
You can access to this view from the group VDI OS Manager, section servers.
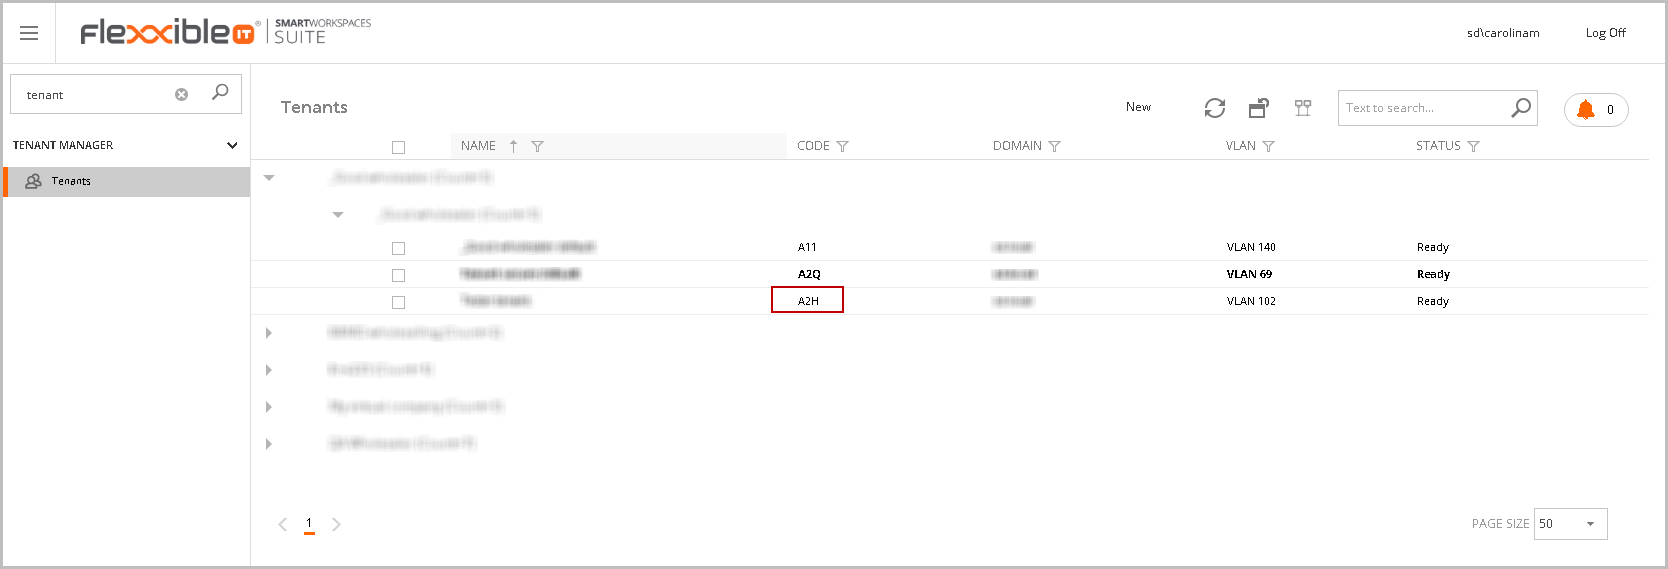
The server name is made up the tenant name and the server name following the pattern <Tenant>-<ServerName>. You can see in this example their corresponding code in the tenants view.
You can personalize this list as shown in the Customizing Lists and Data Export article.
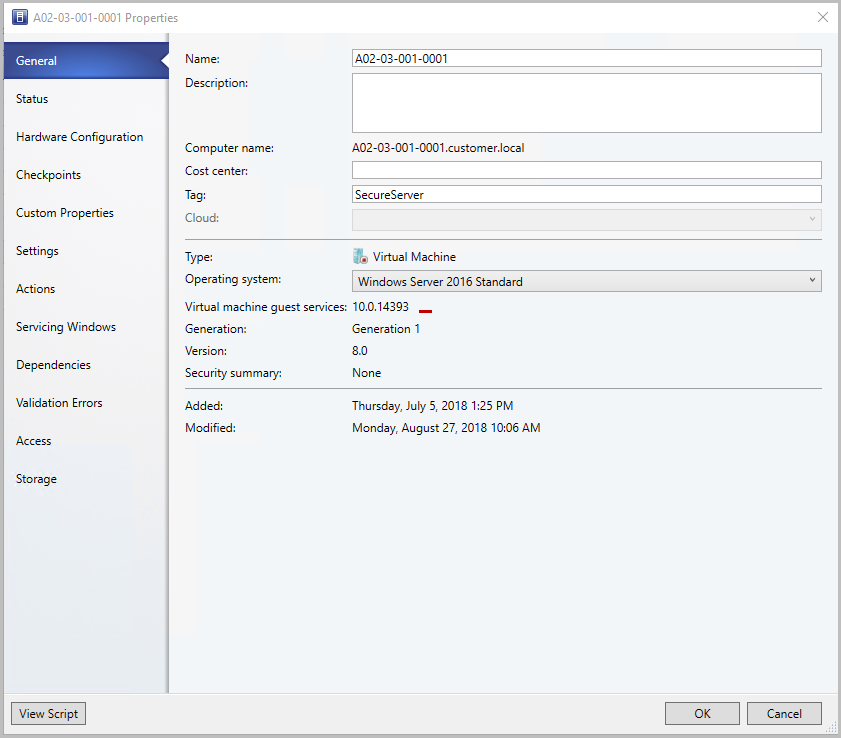
To see any server in this view, you must install VDIClient on this server and assign it the SecureServer tag in the server properties view from Virtual Machine Manager.
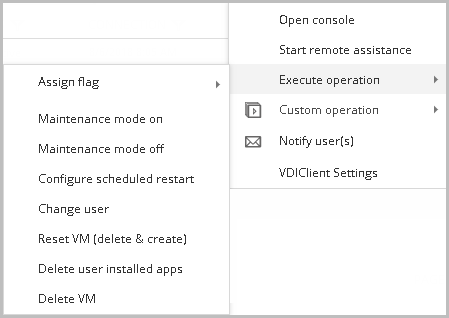
The VDI Client allows you to monitor and perform the following operations for each server:
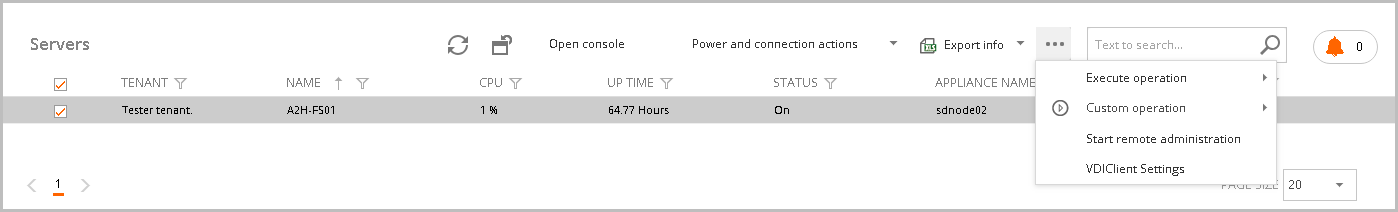
- Open console
- Power and connection actions
- Export info
- Execute operation
- Custom operation
- Start remote administration
- VDIClient Settings
- Search
These operations will be detailed as follow.
Open console
Click in the Open Console button displays a confirm message.
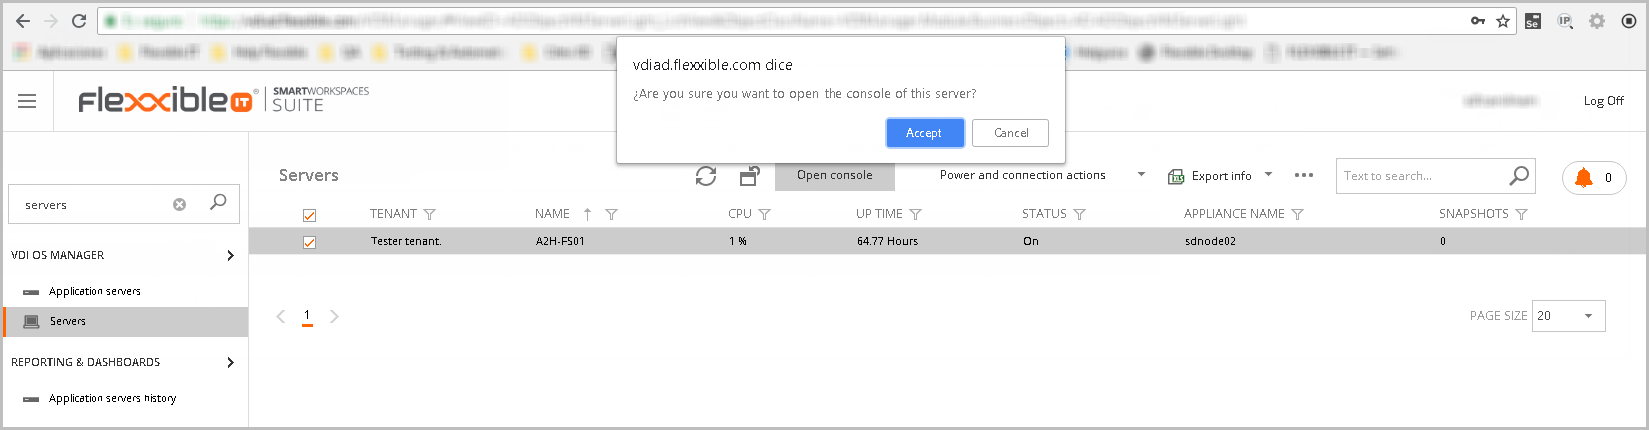
Click in the accept button will open the console.
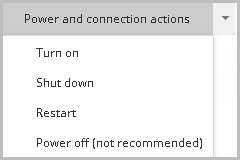
Power and connection actions
You can perform the following actions to the selected server. This will display a confirmation message previously to the performance.
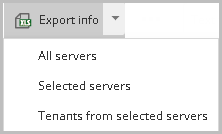
Export info
This button allows to export the following information in excel format.
Execute operation
You can perform through this option the next operations: billable and non-billable.
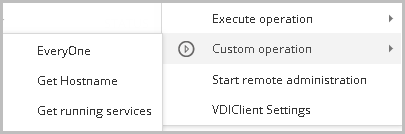
Custom operation
You can perform any defined custom operation in the selected server.
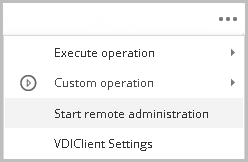
Start remote administration
This option downloads a remote desktop connection file to connect via rdp to the server.
VDIClient Settings
This option opens the quick setting modal window to configure for this server.
Finally, you can customize this list as shown in the Customizing Lists and Data Export article.
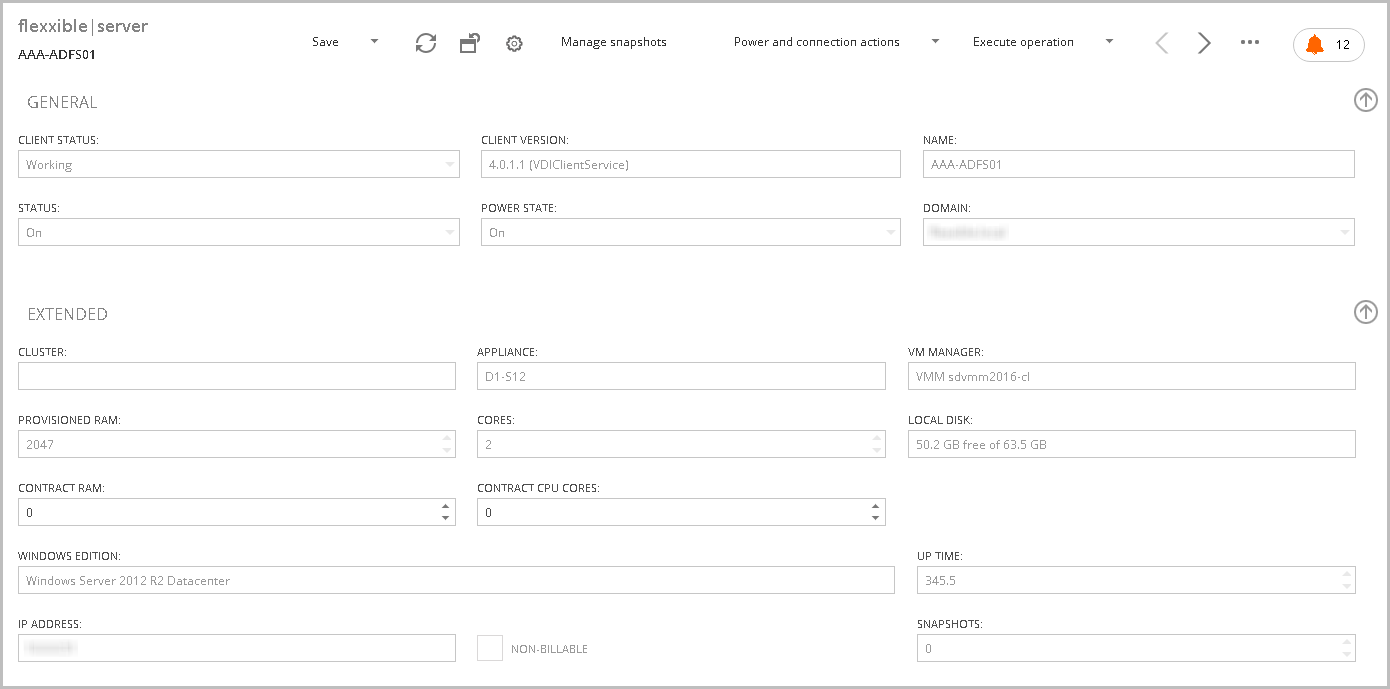
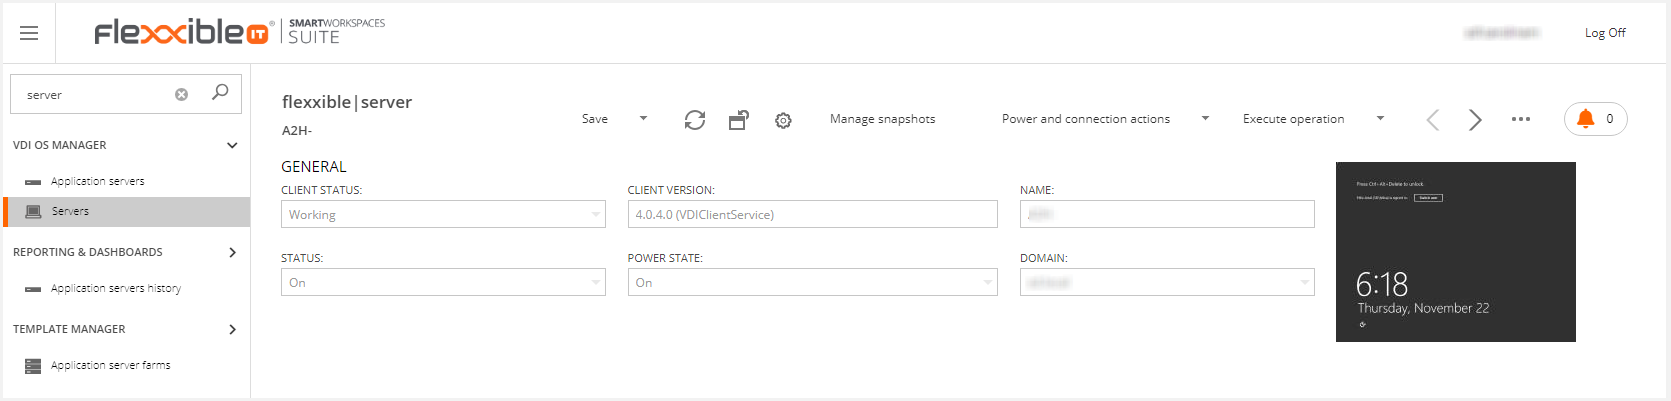
Server Detail
The server detail shows information about the server (general, extended, performance, etc.) and allows to make some operations like
- Change settings
- Manage snapshots
- Power and connection actions (as described in the previous section).
- Execute operations (as described in the previous section).
- Execute custom operations (as described in the previous section).
- Templates (as described in the previous section).
You can see a preview of the screen of the selected server from version 4.0.5 or later. This feature is only available for Hyper-V.
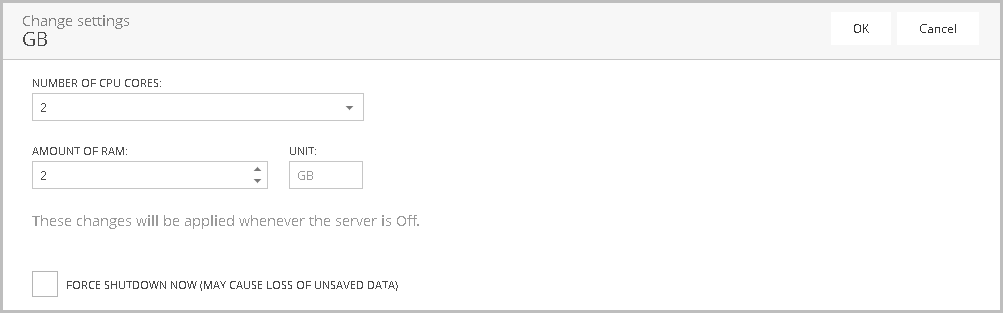
Change settings
You can change the server settings: the CPU cores and the amount of RAM. It's necessary restart the server to apply the changes.
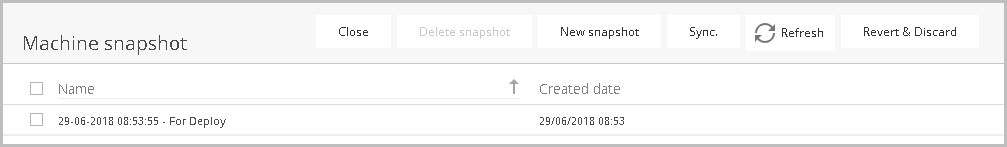
Manage snapshots
You can manage the server snapshots clicking this option. It will display a modal window that contains all the machine snapshots. You can read more information visiting the Snapshot control system article.
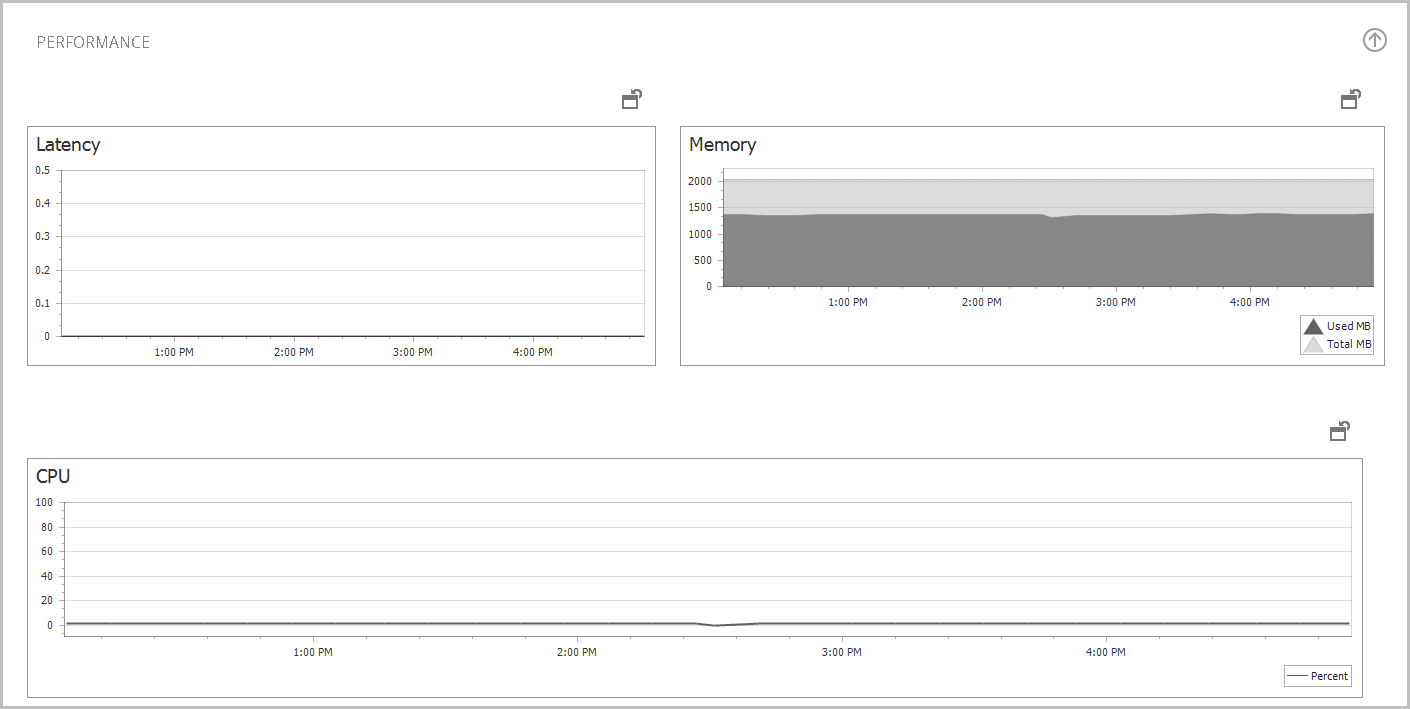
Performance
The performance graphs provide three fundamental data in the diagnosis of problems:
- CPU use: Very useful to identify defects in the sizing of the server.
- Memory use: Same as before.
- Latency: The latency is one of the most important aspects in terms of performance and user experience on a desktop. If the latency is above 150 ms, the user experience begins to suffer, after 200 ms it is directly inaccessible for the user.
Tabs area in the server view
In the bottom of the page you can see a tabs area. In this section you can perform operations on some of these tabs.
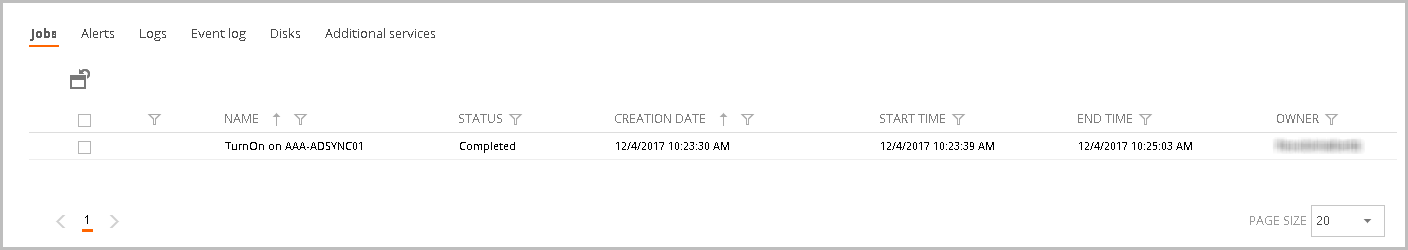
Jobs tab
The Jobs tab shows all the jobs performed on the server. This view displays the following information:
- Name: Job name.
- Status: Job status (Pending, in process, completed, error, user cancelled or timeout).
- Creation date: Job creation date.
- Start time
- End time
- Owner: The job creation user.
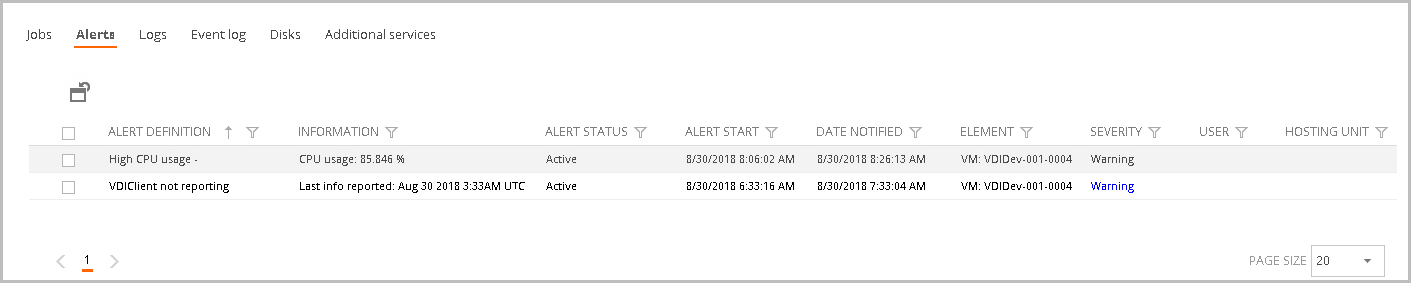
Alerts tab
The Alerts tab shows the subscribed alerts when the threshold defined in the parameter to be monitored is reached.
- Alert definition: The alert name.
- Information: The alert detail.
- Alert Status: The alert status. Can be active or incative.
- Alert Start: The alert start time.
- Date Notified: The alert notification date.
- Element: The affected server.
- Severity: Level of alert severity. Can be warning, error or critical.
- User: The user that generates the alert (if applies).
- Hosting Unit: The hosting unit related (if applies).
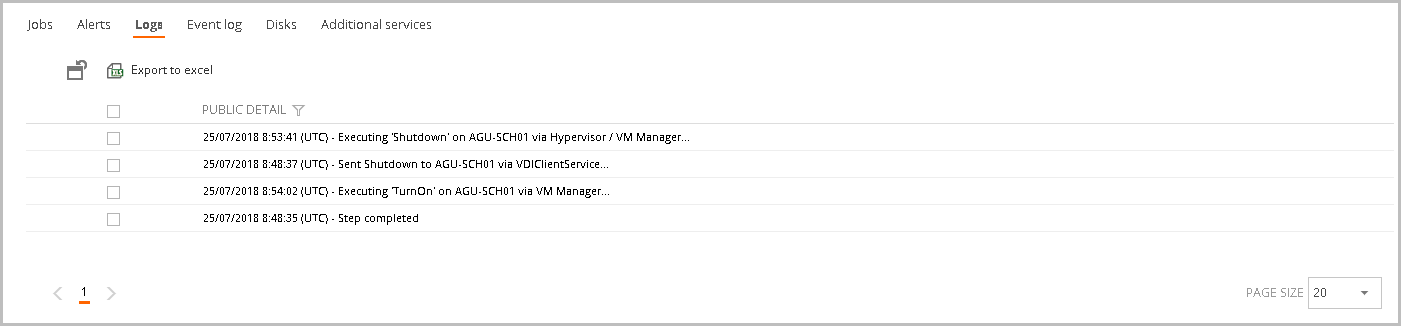
Logs tab
The Logs tab shows all the service related jobs.
Event log tab
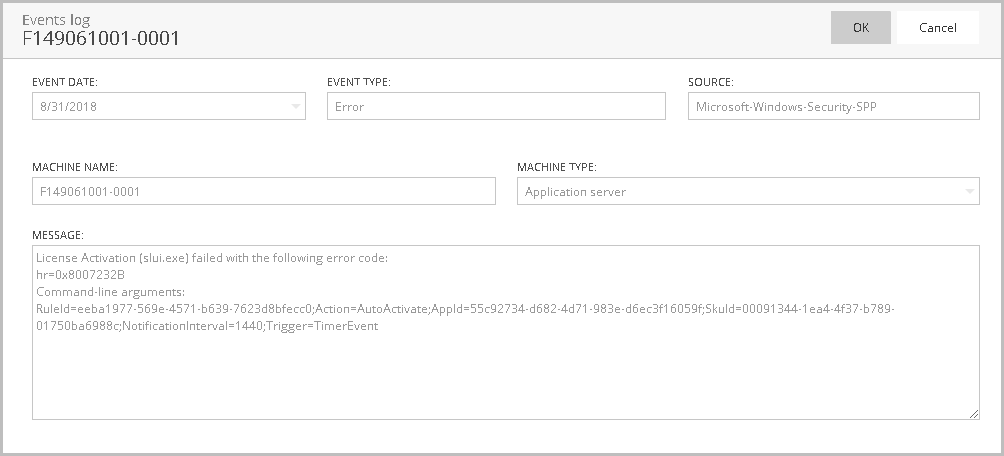
The Event log tab collects the error events from desktops and infrastructure servers. Clicking you can see more detailed the event log in a modal window.
- Date: The date the event occurred.
- Type: Type of event (Information, Warning, Error, Success Audit and Failure Audit)
- Source: The source which generated the event. It could be an application or system component
- Message: The event description.
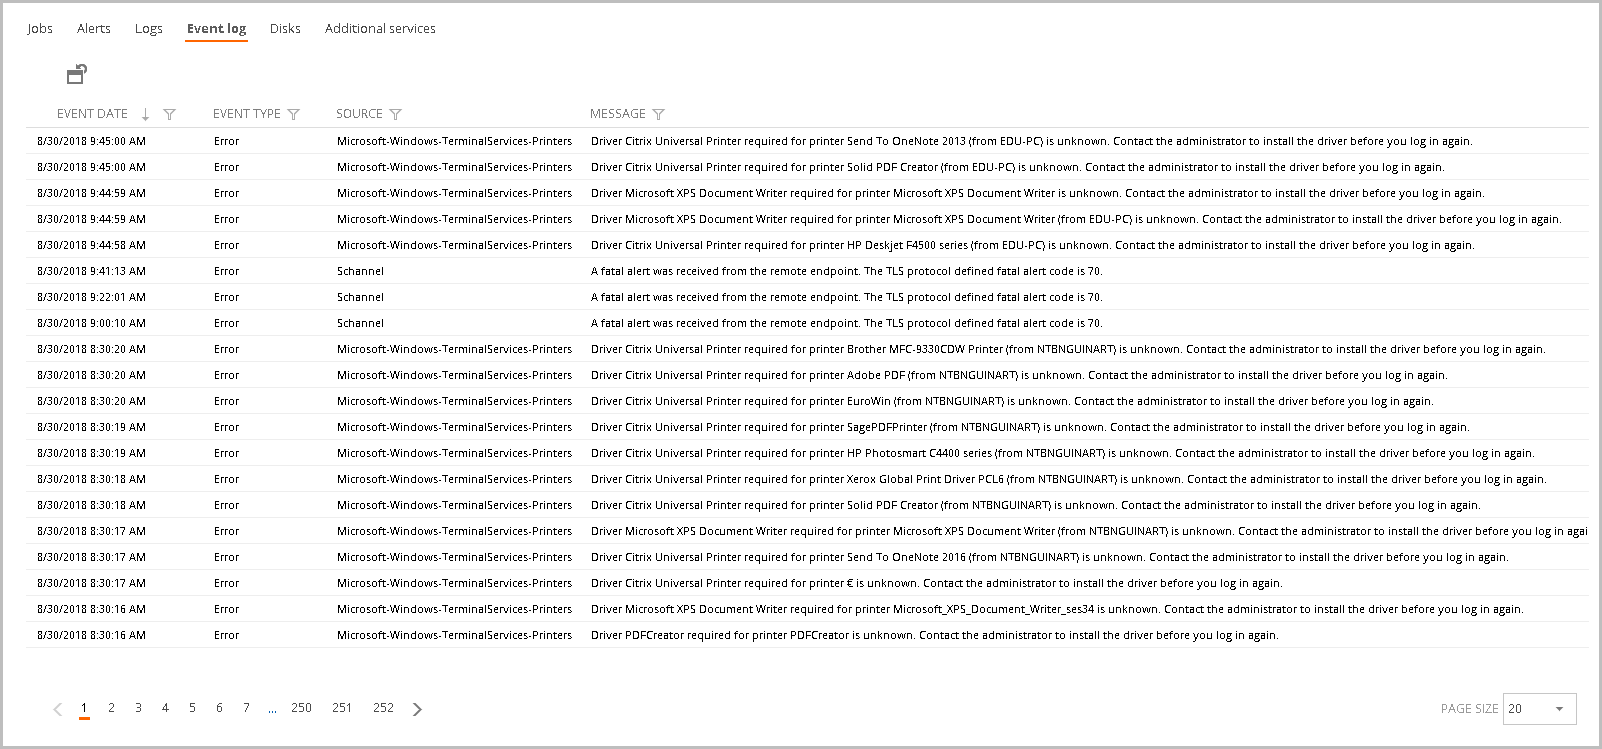
By clicking on the desired item, a modal window with more information about the selected event record is displayed.
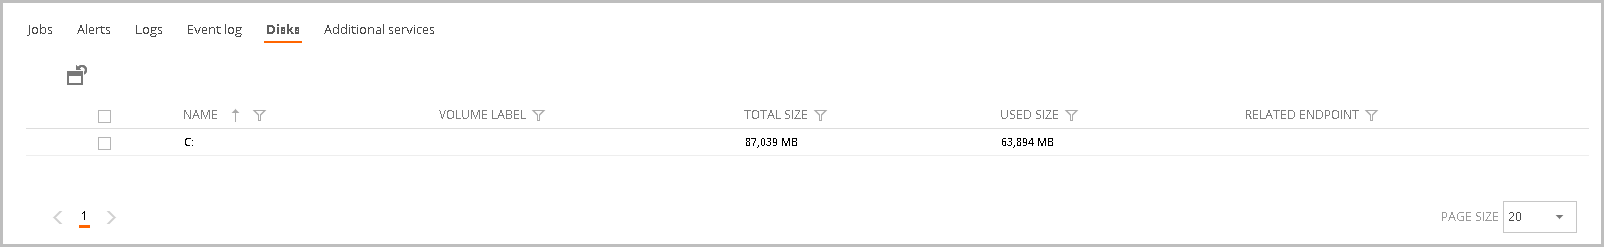
Disk tab
The Disk tab shows the server available disks and useful information.
- Name: The disk name.
- Volume label: The disk volume label.
- Total size: The disk total size in MB.
- Used size: The disk used size in MB.
- Related Endpoint: The related endpoint (if applies).
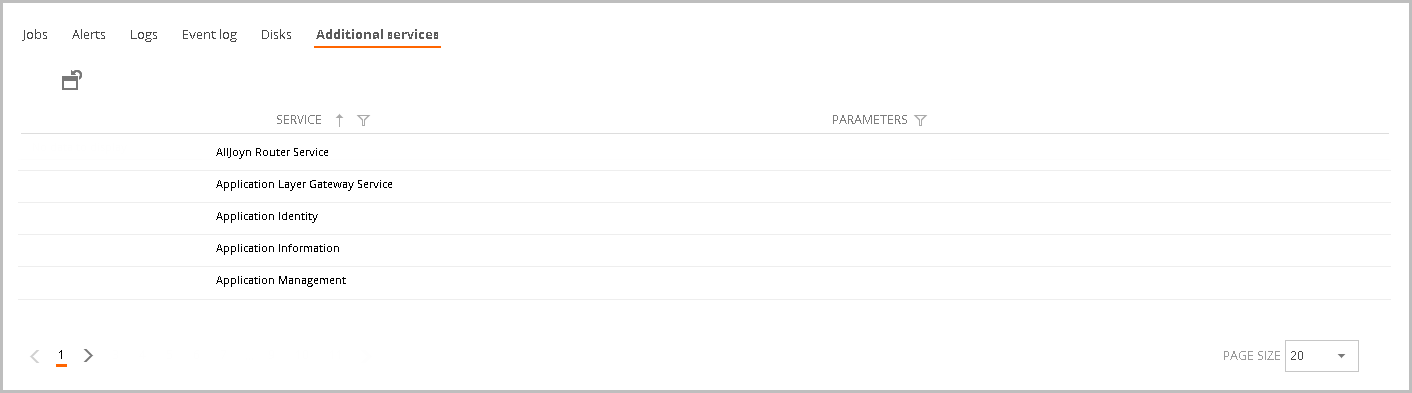
Additional services tab
The Additional services tab shows the running services and their parameters.
- Service: Service name.
- Parameters: Defined parameters (if applies).