The Application server view provides an overview of all available application servers on the infrastructure.
Application Server Lists
The application servers lists shows the following information for each item:
- Machine name: The application server name.
- CPU: Percentage of used CPU.
- % Ram: The percent of Ram usage.
- Up Time: Hours of activity from the last restart.
- Status: The application server status (ready, active, disconnected, off, on, unregistered, or in maintenance).
- Sessions: Number of active sessions on the server.
- Tenant: The application server tenant name.
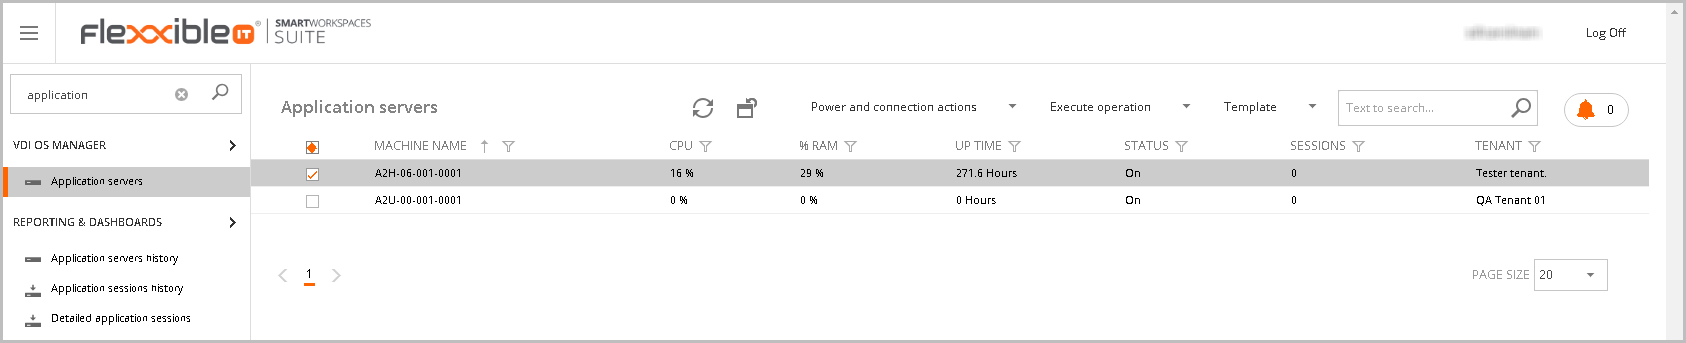
You can access this view from the VDI OS Manager menu option, at the Application Servers section.
The following operations are allowed on a selected server in the servers list:
- Power and connection actions
- Execute operation
- Template
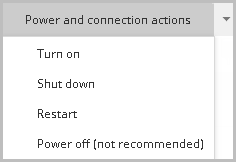
Power and connection actions
The power and connection actions that you can perform are the following: Turn on, shut down, restart, log off, disconnect, power off, and force restart.
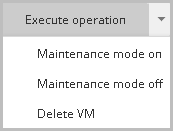
Execute operation
You can perform through this option the next operations: Maintenance mode on, maintenance mode off and Delete VM.
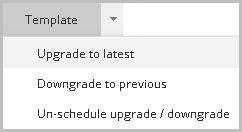
Template
The template option allows the schedule or cancels the upgrade or downgrade of the template version.
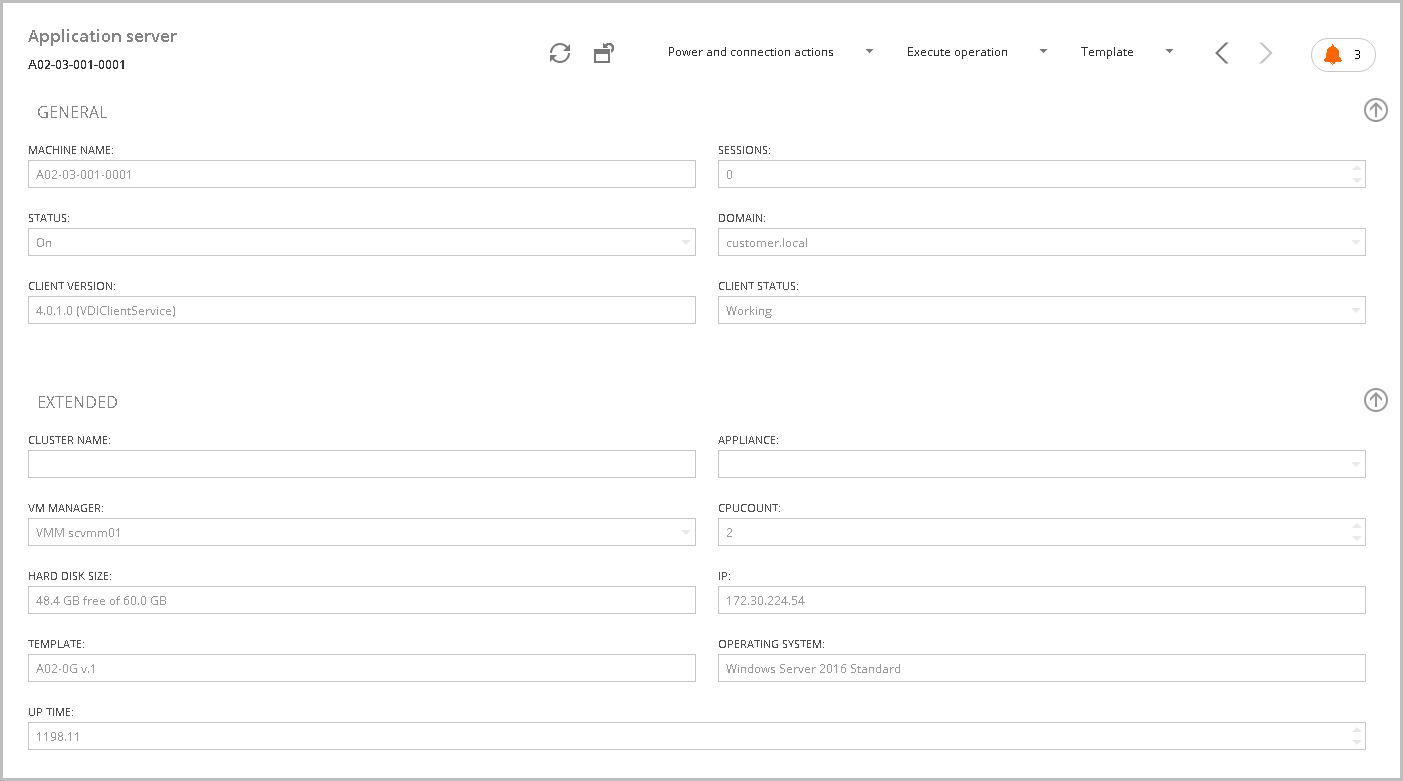
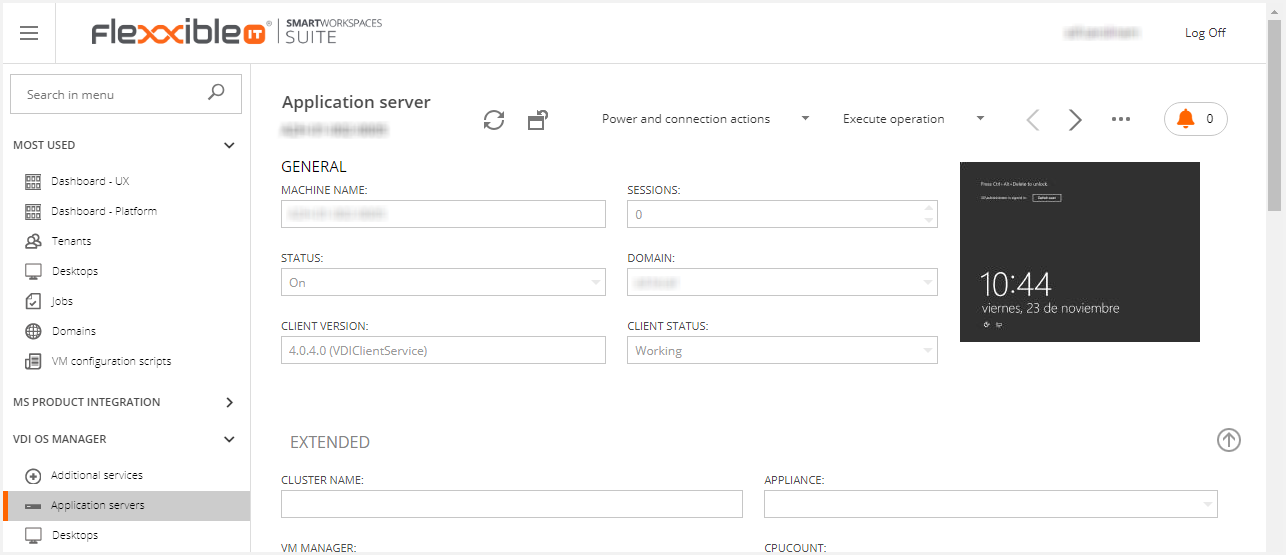
Application Server Detail
The desktop detail shows information about the desktop (general, extended, performance, etc.) and allows to make some operations like
- Power and connection actions (as described in the previous section).
- Execute operations (as described in the previous section).
- Templates (as described in the previous section).
You can see a preview of the screen of the selected application server from version 4.0.5 or later. This feature is only available for Hyper-V.
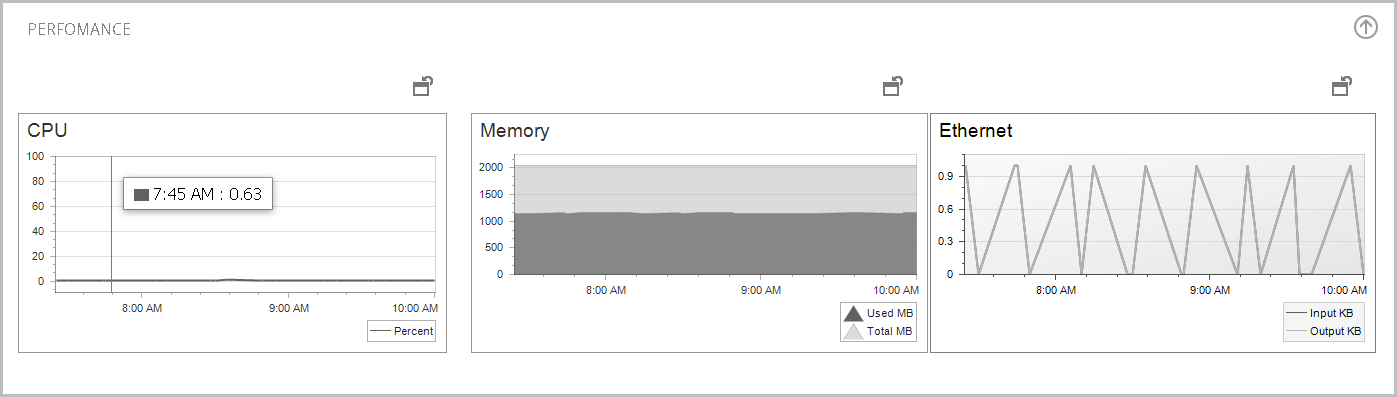
Performance
The performance graphs provide three fundamental data in the diagnosis of problems:
- CPU use: Very useful to identify defects in the sizing of the server.
- Memory use: Same as before.
- Ethernet: The network traffic is a very useful graph to detect anomalous behavior in the server.
Tags area in the application server view
At the bottom of the page you can see a tags area. In this section, you can perform other operations in any tabs.
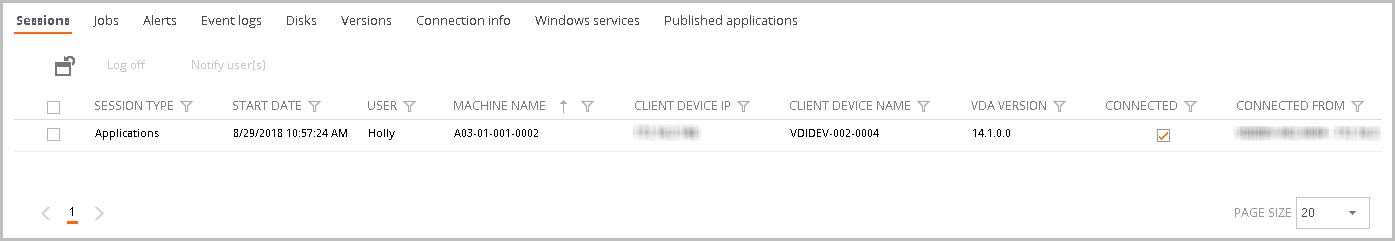
Sessions tab
The Sessions tab shows the open sessions on the server and information about the session.
- Session type: The session type (desktop, applications or server)
- Start date: The session start date.
- User: Login user.
- Machine name: The application server name.
- Client device IP: IP from the client is connected.
- Client device Name: The name of the device from the client is connected.
- VDA Version.
- Connected: Check if the user is connected.
- Connected from.
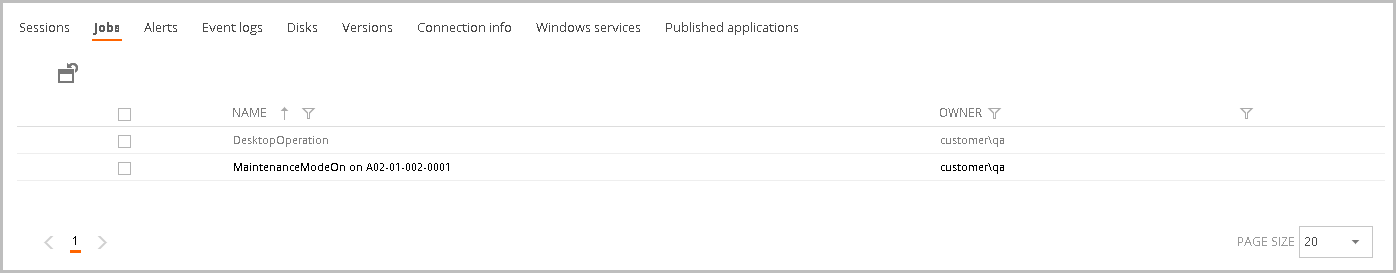
Jobs tab
The Jobs tab shows all the jobs performed on the application server. This view displays the following information:
- Name: Job name.
- Owner: The job creation user.
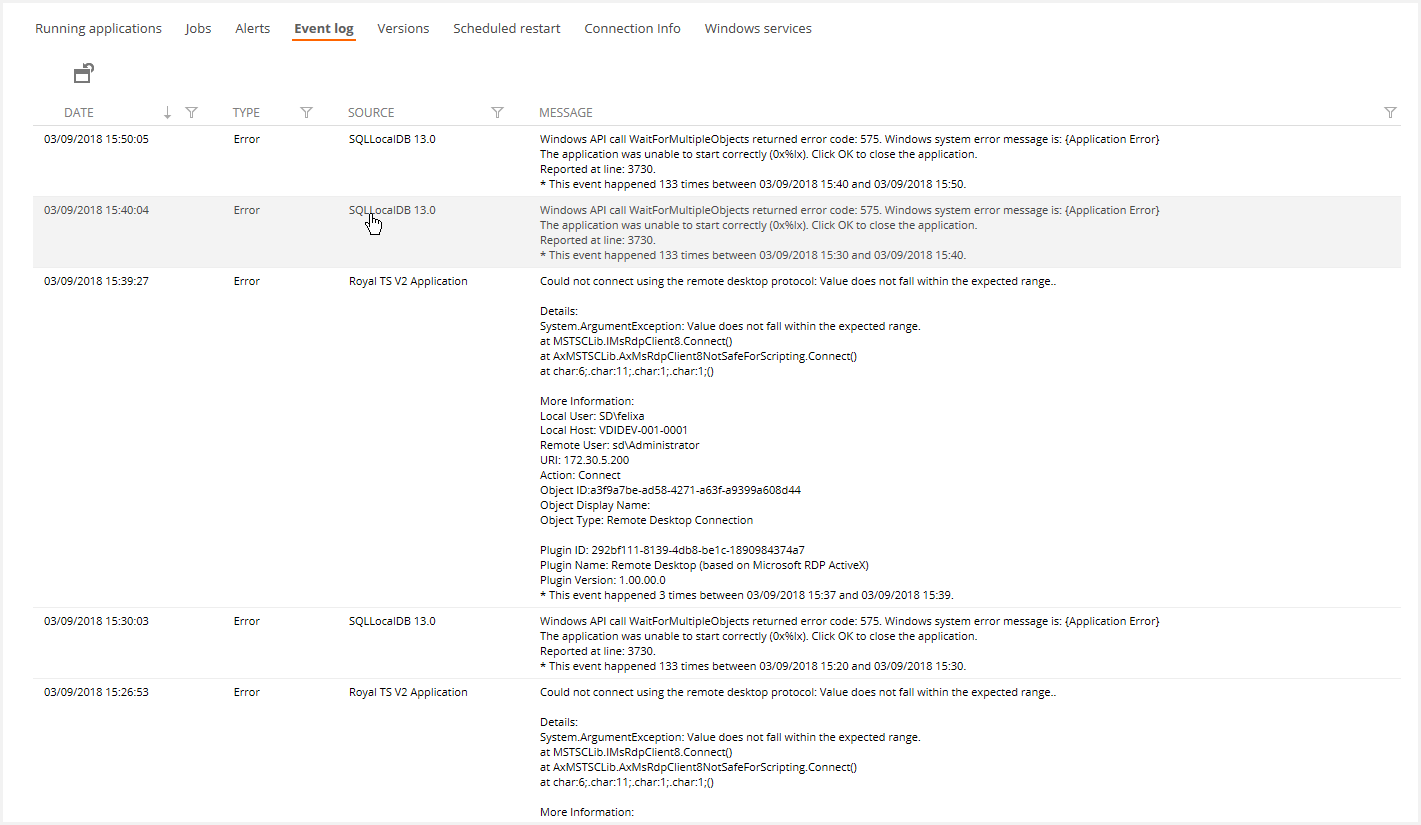
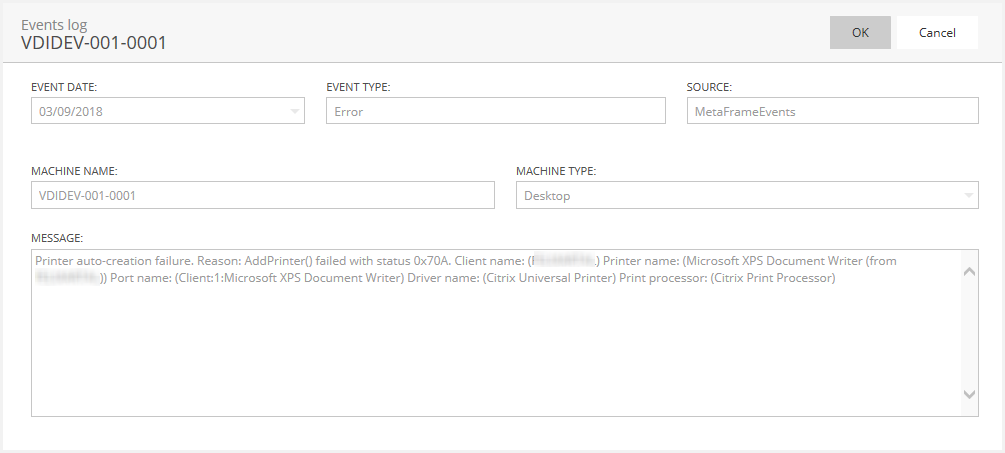
Event Log tab
The Event log tab collects the error events from desktops and infrastructure servers. Clicking you can see more detailed the event log in a modal window.
- Date: The date the event occurred.
- Type: Type of event (Information, Warning, Error, Success Audit and Failure Audit)
- Source: The source which generated the event. It could be an application or system component.
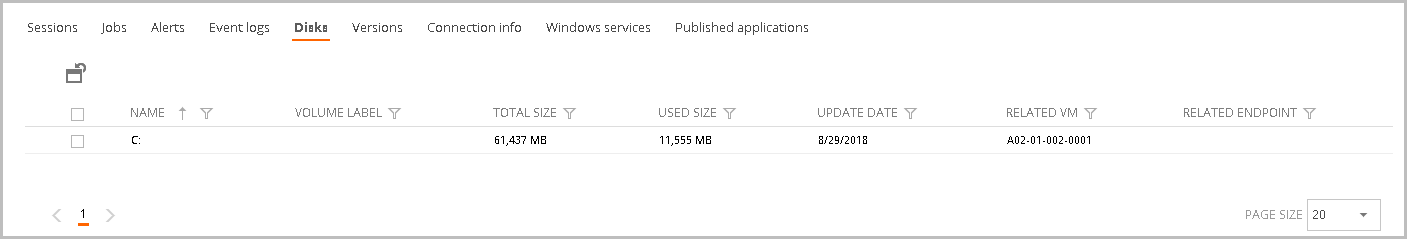
Disk tab
The Disk tab shows the server available disks and useful information.
- Name: The disk name.
- Volume label: The disk volume label.
- Total size: The disk total size in MB.
- Used size: The disk used size in MB.
- Update date: The disk update date.
- Related VM: The related VM (if applies)
- Related Endpoint: The related endpoint (if applies).
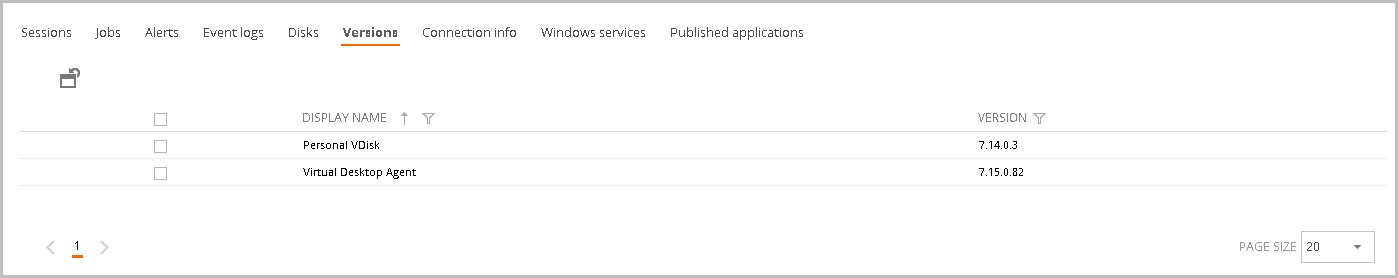
Versions tab
The Versions tab shows all the Versions of the installed Citrix Services.
- Display name: Citrix Service Name.
- Version: Service version.
Connection info tab
The Connection Info tab we can see the following information:
- Log in: The login date.
- Log off: The log-off date.
- IP: The IP of the user who logged in.
- VM: VM name.
- Session key.
- Connection ID: The connection ID.
- Related user: The log in the related user.
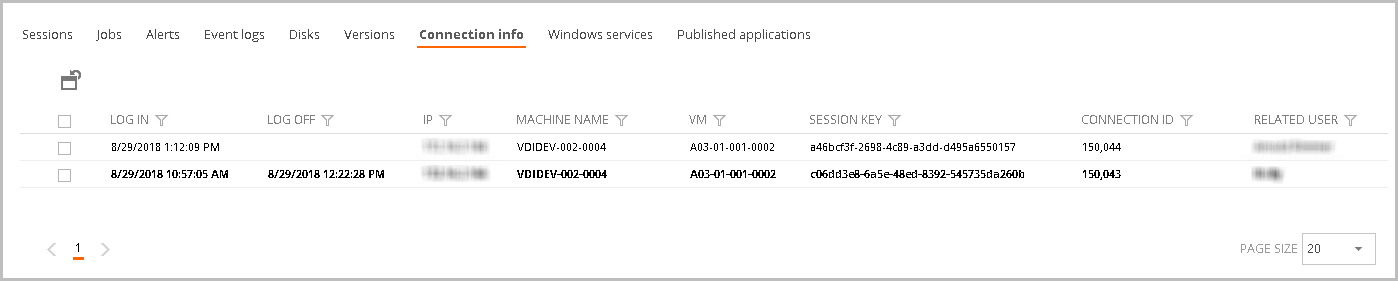
You can click on the connection to see more information.
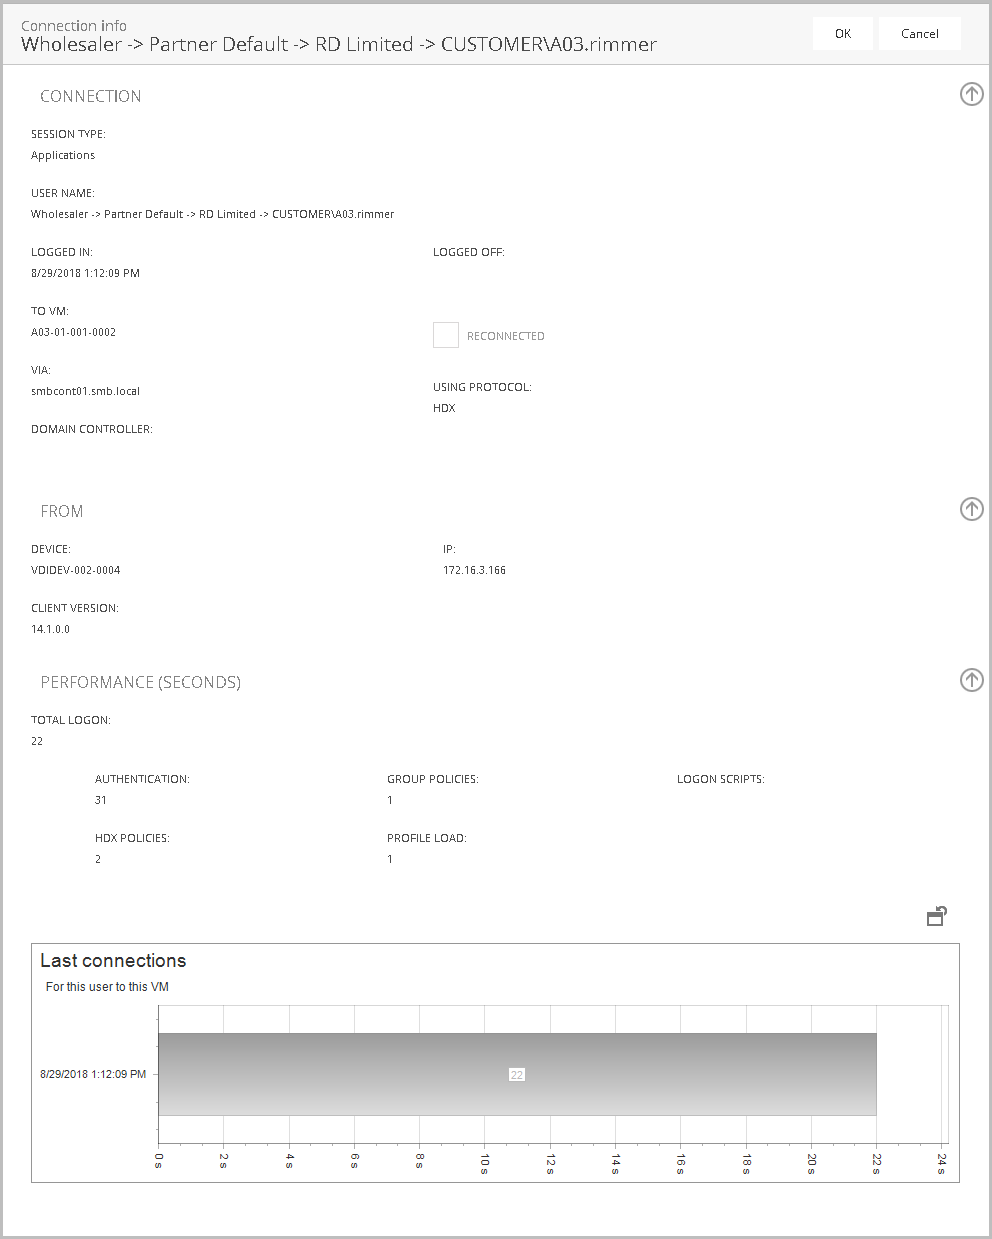
Windows services tab
The Windows Services Tab is a view of the system services. This allows start, stop, and restart services.
- Name: The windows services short name.
- Display Name: The windows service name.
- Status: The service status (stopped or running).
- Startup type: The service startup type (Manual, Disabled, or Auto).
- Log on as: The service logon account.
- Path: The service path.
- Accept stop: If the server allows being manually stopped.
- Update date
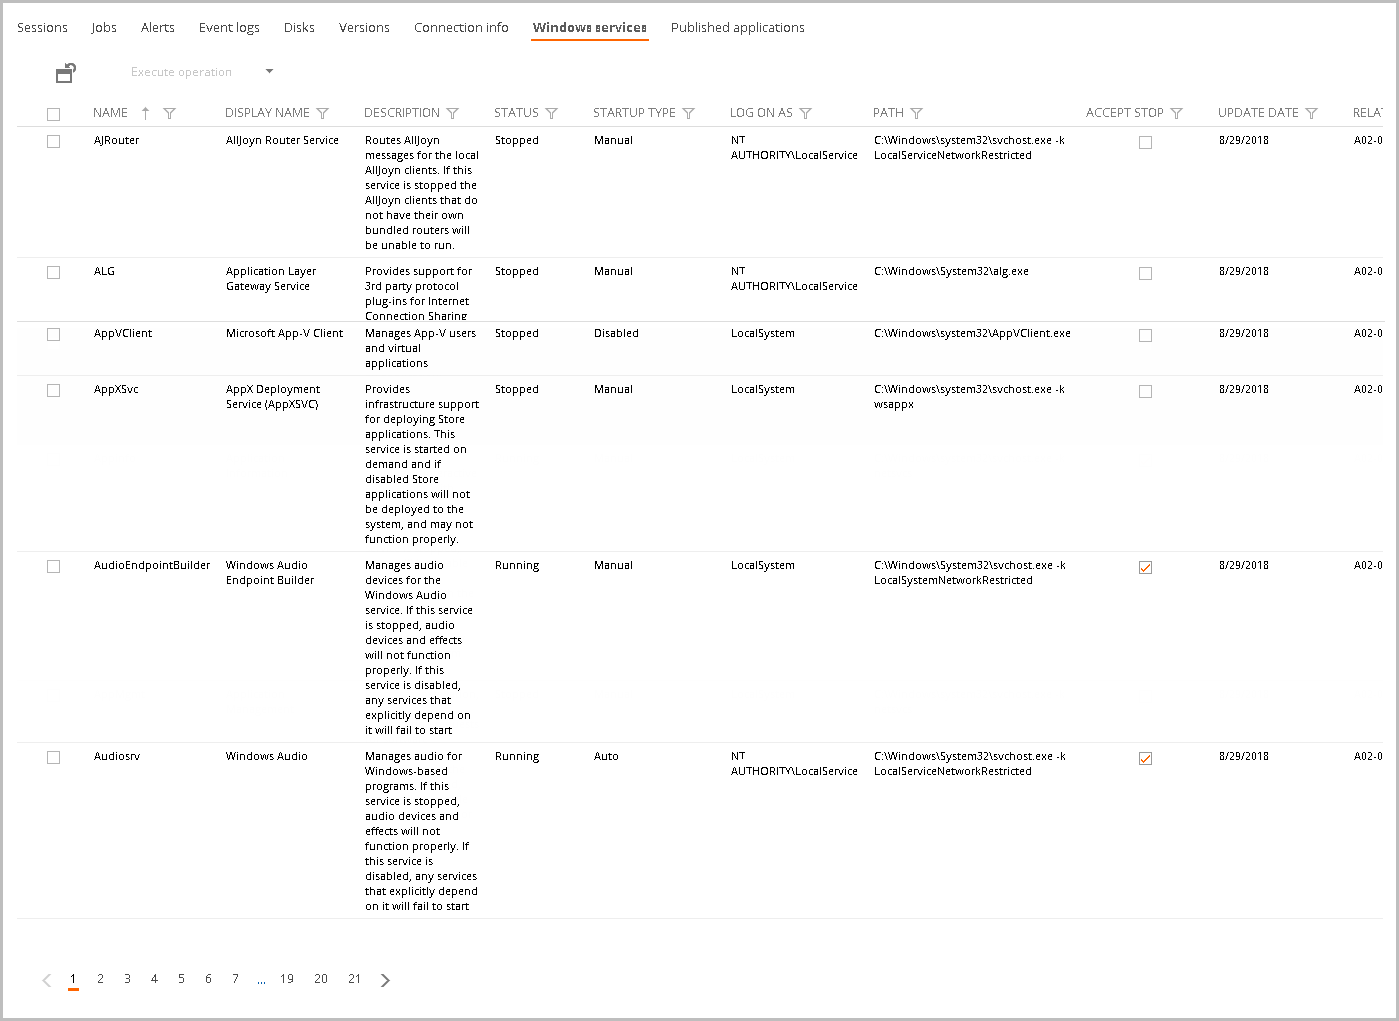
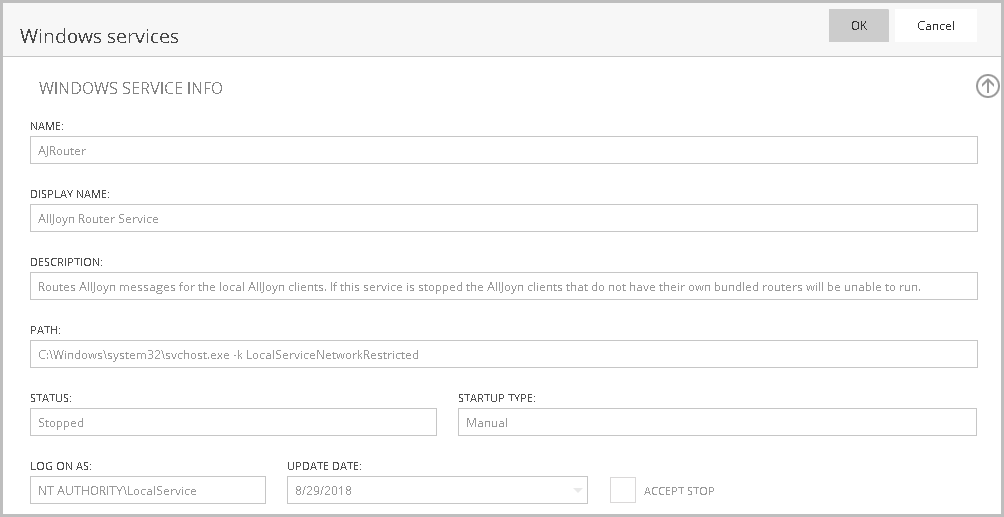
If you click in the service, it displays a modal window with the service detail.
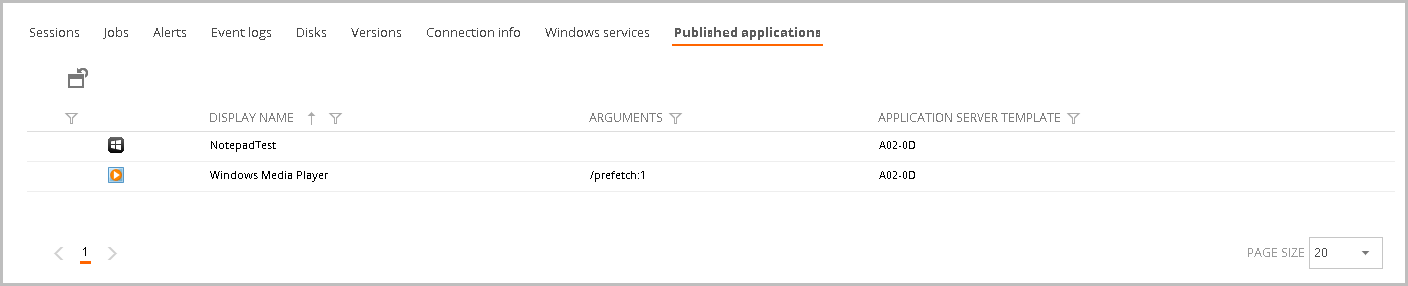
Published application tab
The published applications tab shows all the published applications on the server. In this view, you can see the arguments and the application server template.
- Display name: The application display name.
- Arguments: The launch arguments (if applies).
- Application server template: The application server template name.