Within Flexxible|VDI OS Manager you can obtain lots of information, so that when a user experience issue is reported, an end-to-end diagnosis of the issue can be carried out, in order to find its cause and provide a solution.
Desktop performance diagnosis:
Within the desktop properties, you can obtain helpful information for the diagnosis process, some of which is as follows:
Resource consumption:
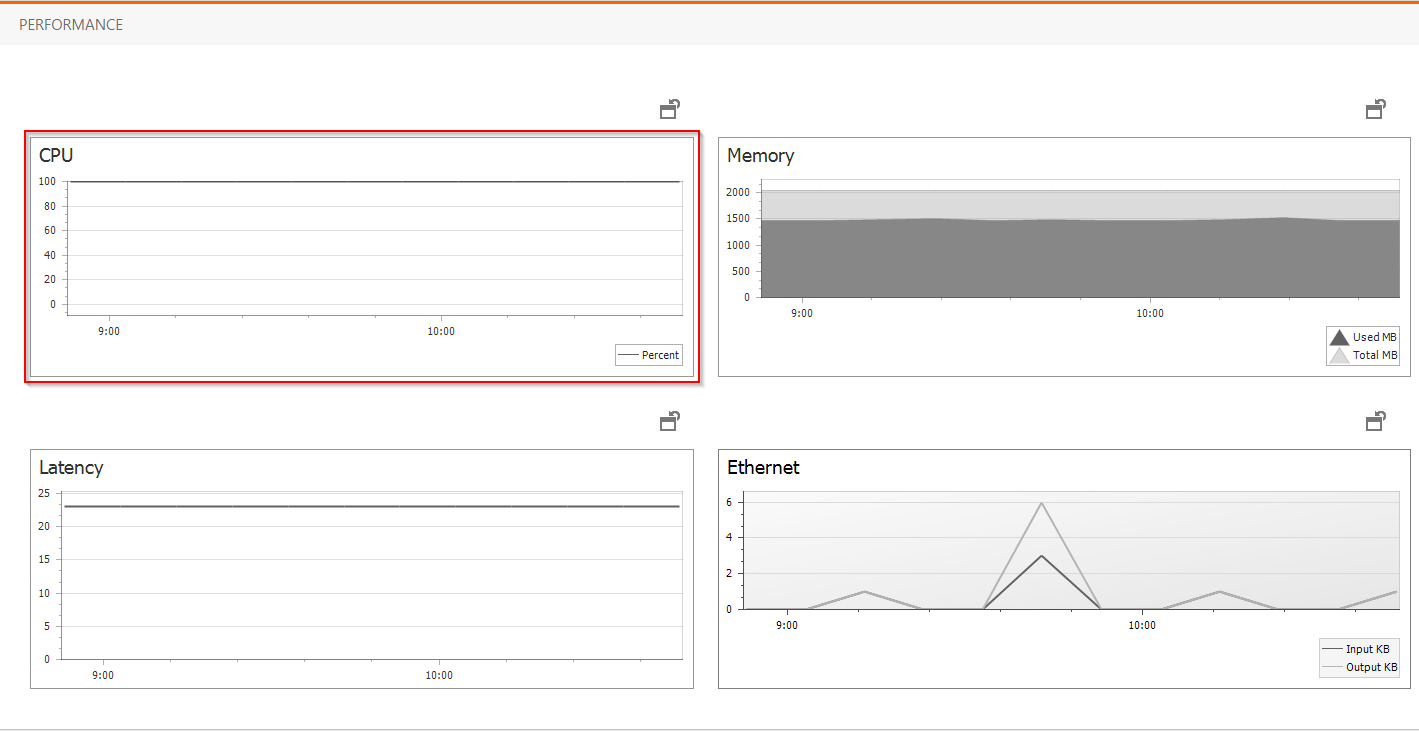
In this case, it is very clear that the desktop's CPU fixed at 100% indicates an issue with the desktop's dimensioning or an application.
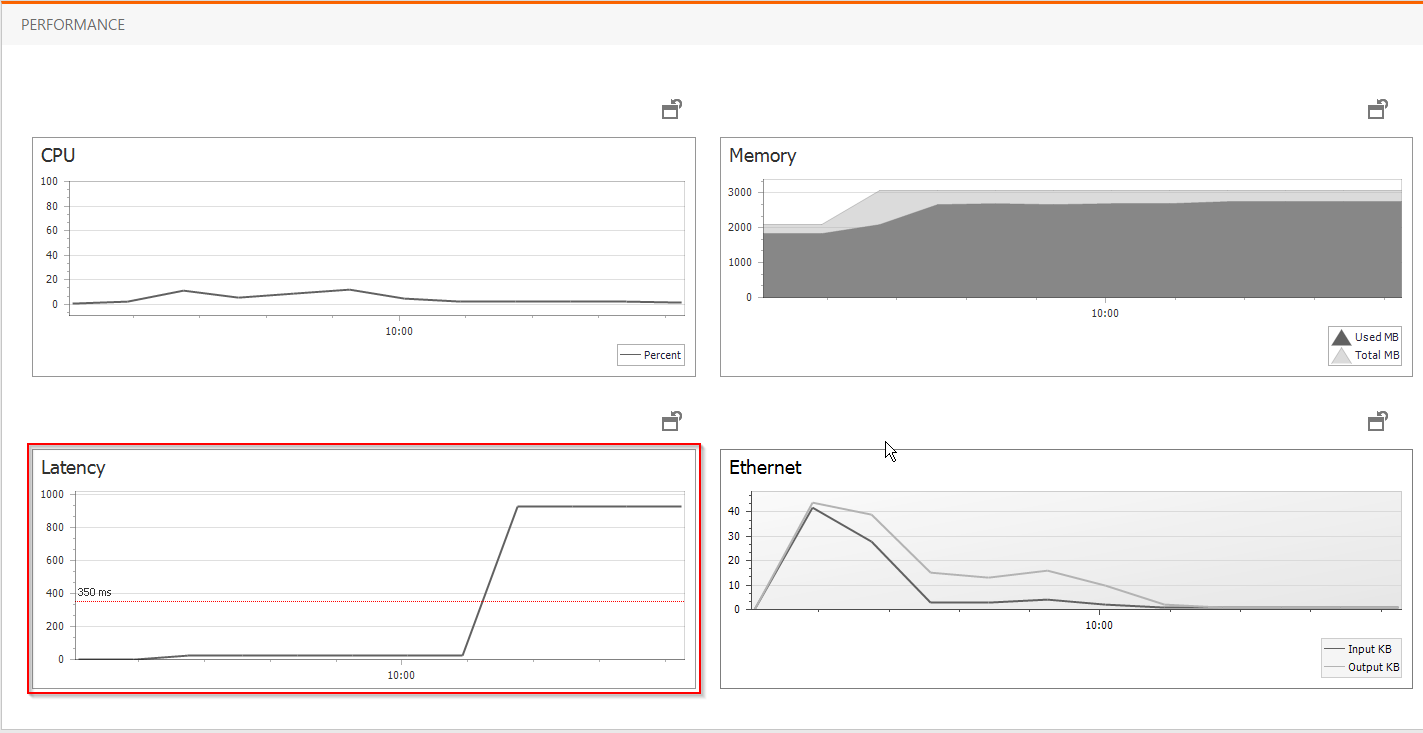
Connectivity issues:
Desktop active alerts:
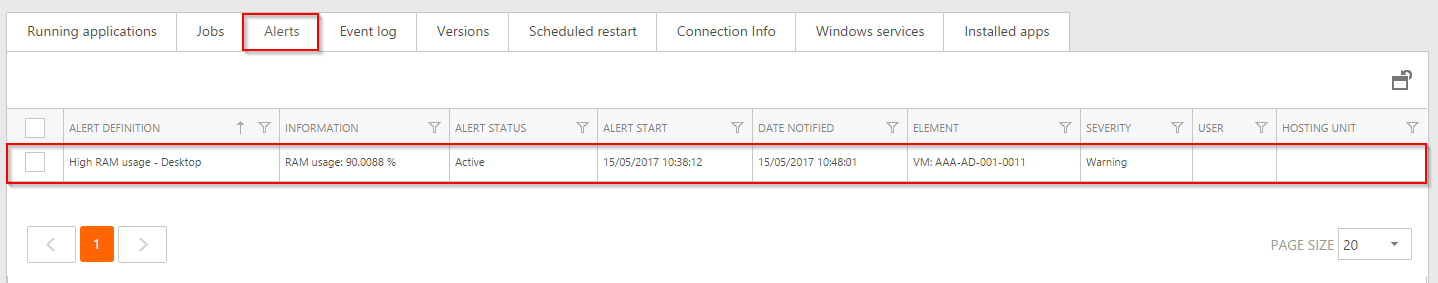
If the desktop reaches the threshold established in the alert definition, notifications will be sent to the subscribed profiles, and alerts will be visible on the "Alerts" tab.
Error events:
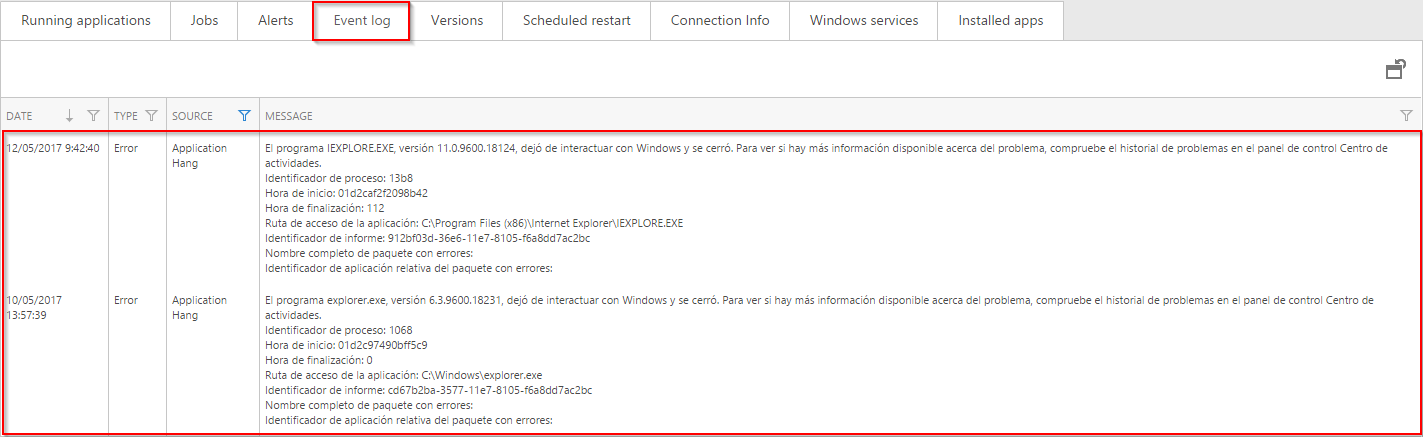
Through the Flexxible|VDI Client agent, error events of the desktop's event viewer are redirected to the "Desktop" view on the "Event log" tab, and in this manner system errors are recorded uniformly, without the need to interrupt users by accessing their desktops to consult information.
Desktop performance diagnosis:
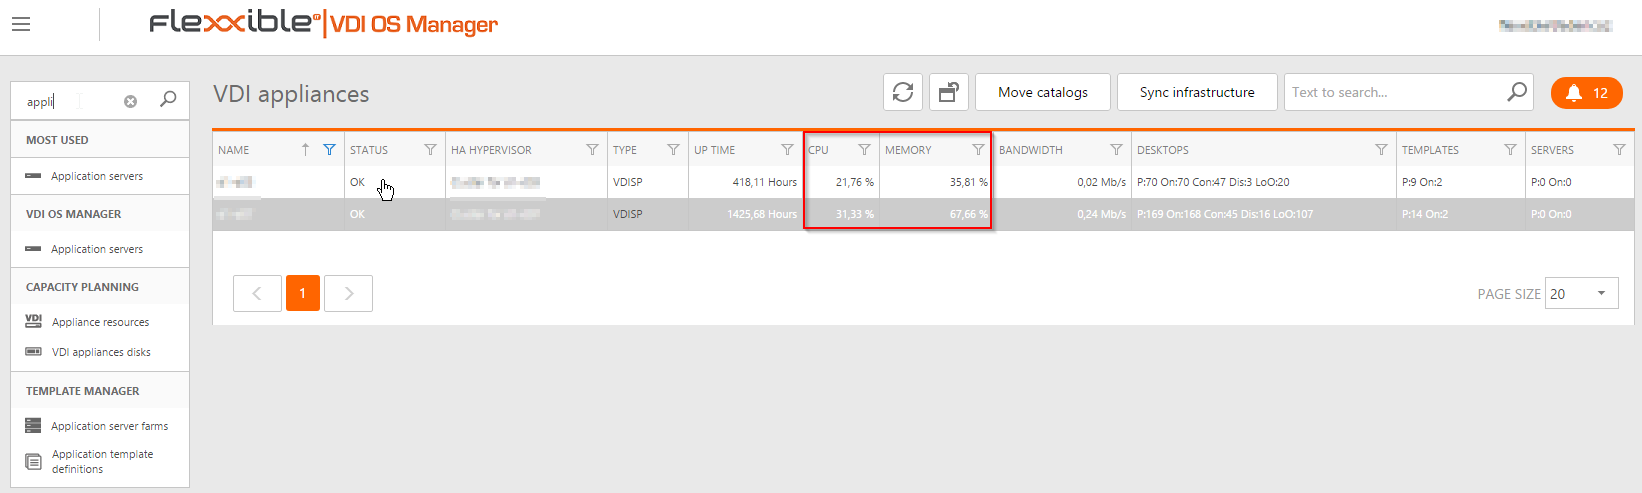
In some cases, user experience issues can originate from the over-provision of resources in a Flexxible|SMB Appliance. To detect this, in the "Appliance resources" view, you can see a snapshot of the use of resources by appliances.
It is advisable to always maintain both the CPU and RAM of appliances under 80% usage, so as not to degrade the user experience.
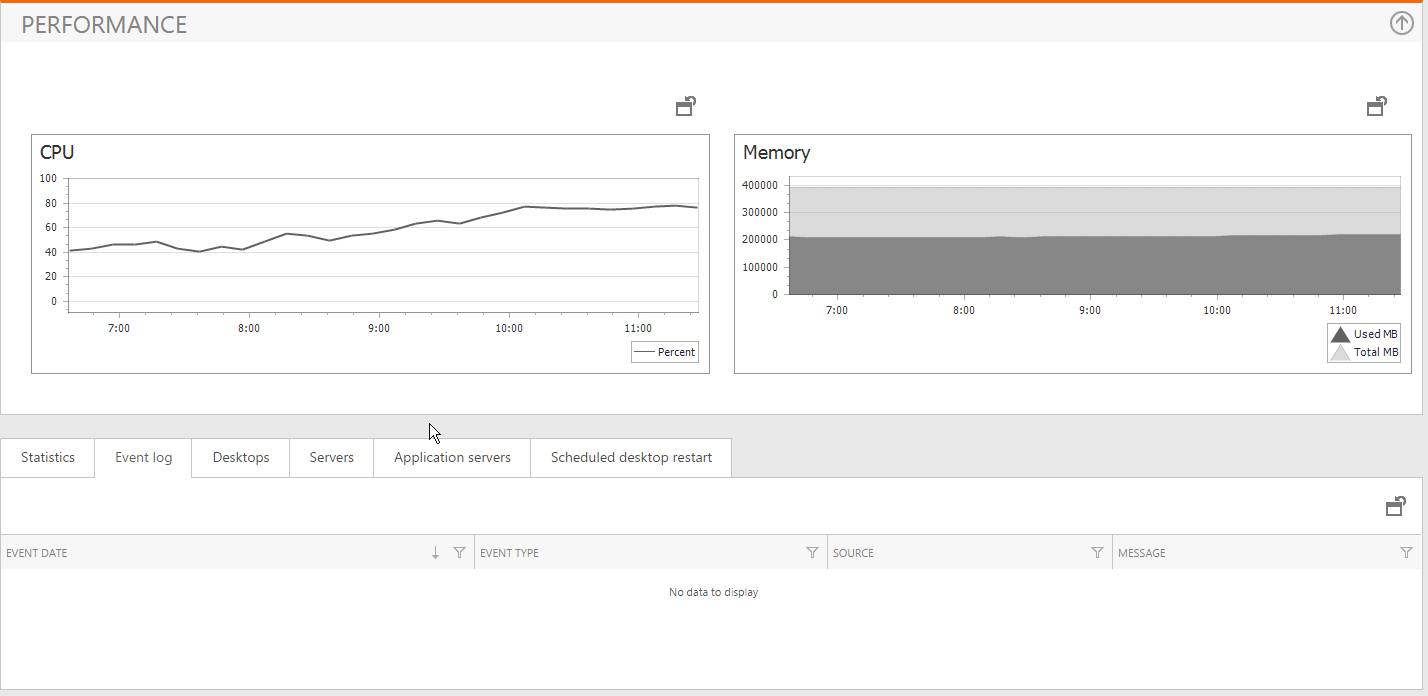
At the same time, if you enter the appliance properties, you can see the resource consumption history, as well as the events redirected to the event viewer from the host, in order to display any relevant events in the diagnosis.