The Dashboard Platform allows the user with the administrator role to track the platform behavior.
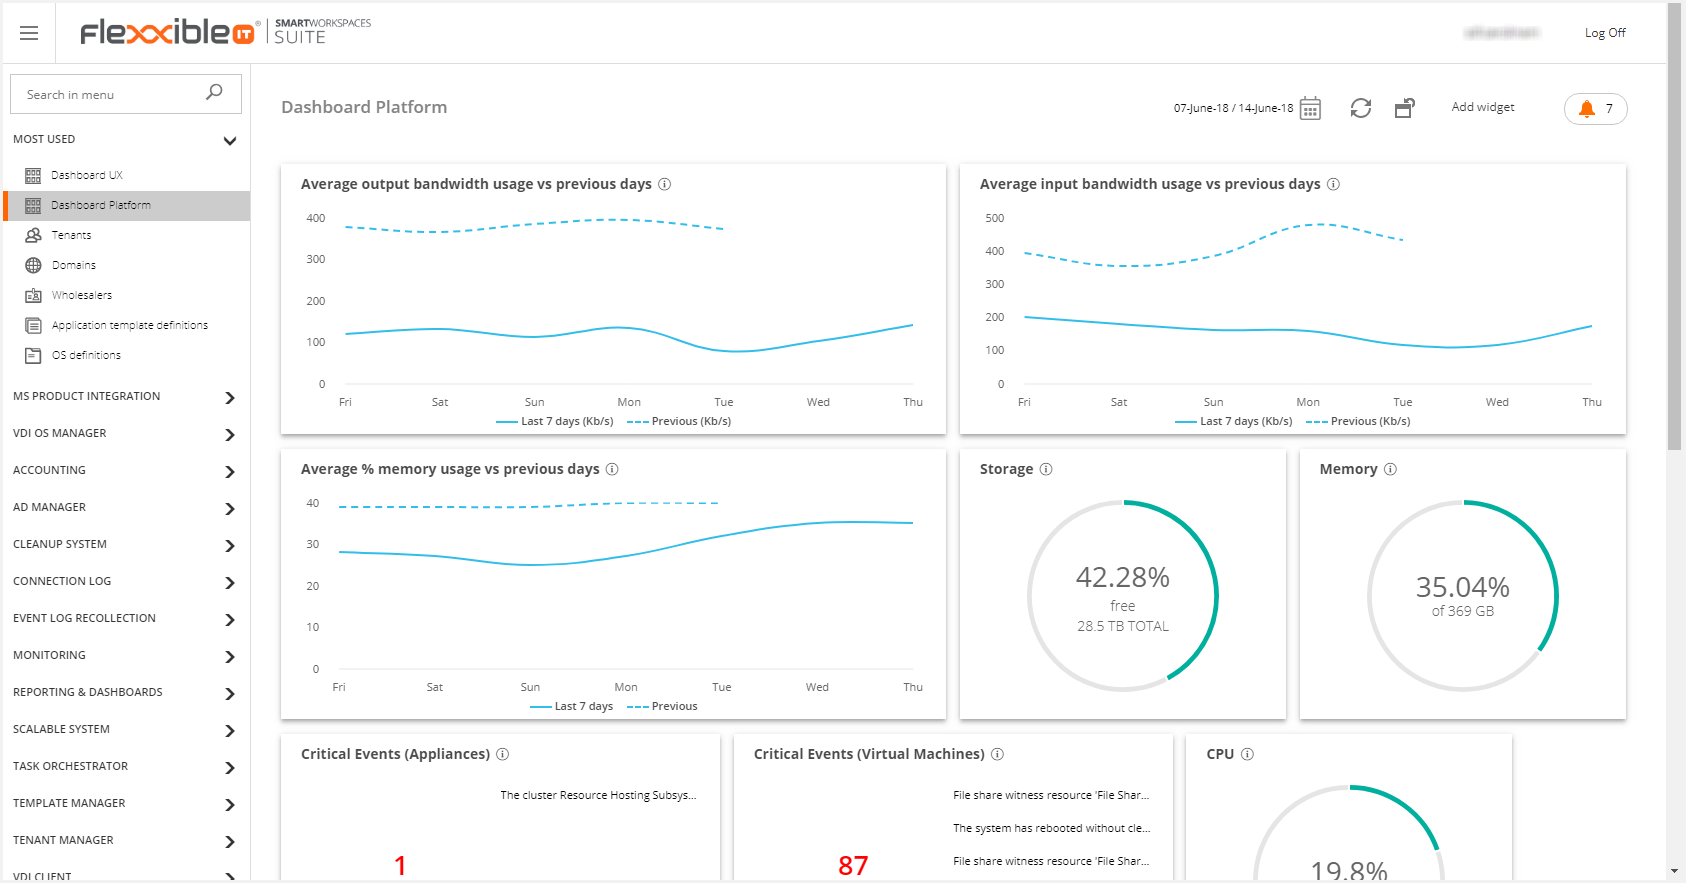
You must consider the tracked info belongs to the Historical data tables. So it is necessary to set up the Historical data to make the dashboards work correctly. If this is not set up, they will not show info. Please, refer to the Setup and Use of Historical data article for more information.
The widgets load by default are the following:
- Average output bandwidth usage vs previous days
- Average input bandwidth usage vs previous days
- Average % memory usage vs previous days
- Login Success
- Memory
- Login average time
- Storage
- Login Performance
- Critical Events (appliances)
- Critical Events (virtual machines)
- CPU
The user can also add these widgets:
- Application Performance
- Average % CPU usage vs previous days
- Bandwidth usage
- Error Events (appliances)
- Error Events (virtual machines)
All the available widgets will be defined below.
Average output bandwidth usage vs previous days
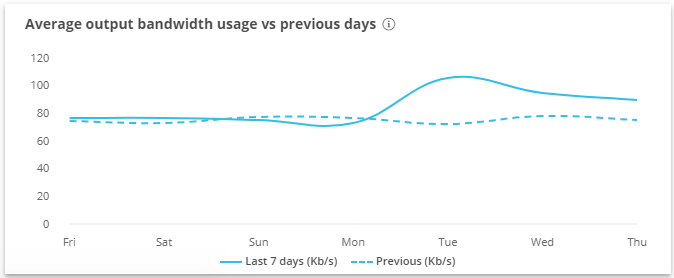
Shows the output bandwidth usage over the last 7 days. It can be compared to the same data from the previous cycle.
Average input bandwidth usage vs previous days
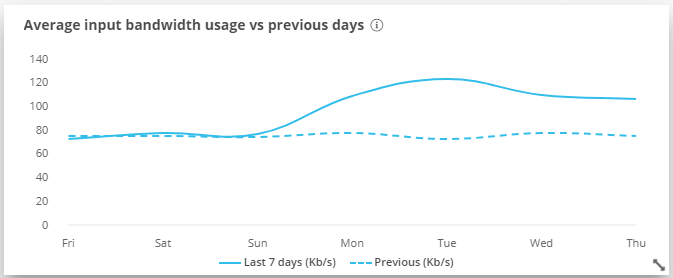
Shows input bandwidth usage over the last 7 days. It can be compared to the same data from the previous cycle.
Average % memory usage vs previous days
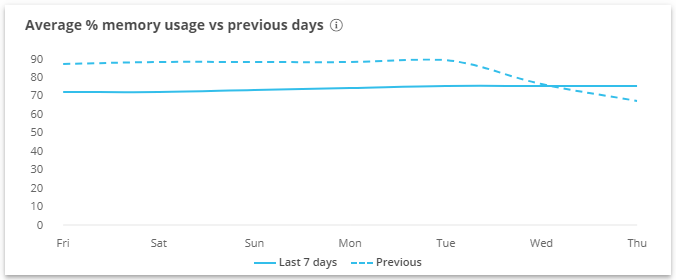
Shows memory usage over the last 7 days. It can be compared to the same data from the previous cycle.
Login Success
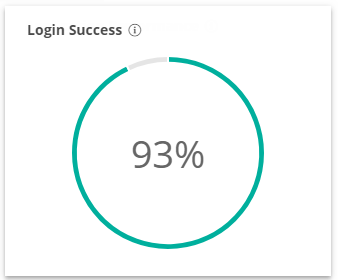
This widget shows the percentage of successful logins over the last 2 hours. Powered by LoginPI.
Memory
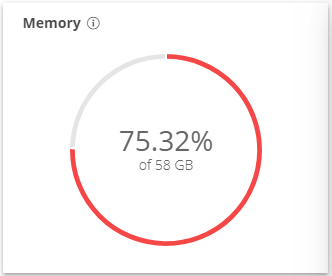
Current combined average RAM utilization for all appliances in the environment.
Login average time
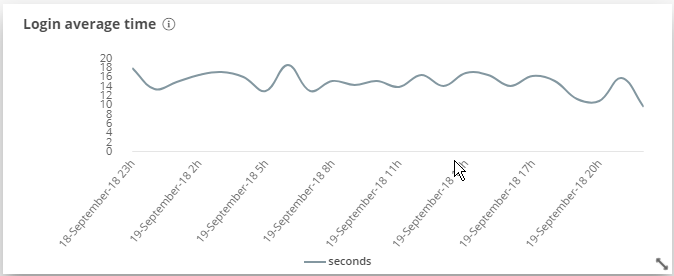
This widget shows the average login times for the configured time frame. Powered by LoginPI.
Storage
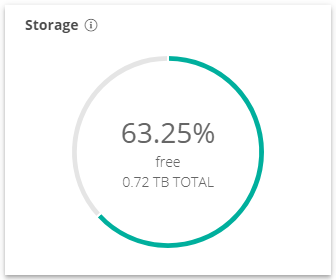
Shows the current percentage of used storage space versus the total amount of available storage of the appliances in the environment.
Login Performance
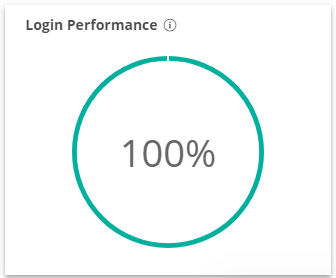
Percentage of logins that were completed within the set threshold over the last 2 hours. Powered by LoginPI.
Critical Events (Appliances)
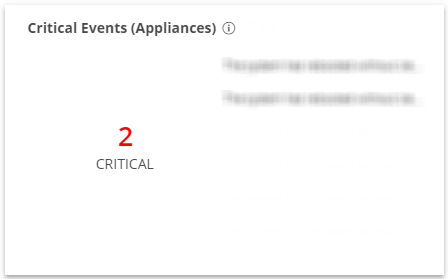
Shows critical events from the physical layer for the current timeframe.
Critical Events (Virtual Machines)
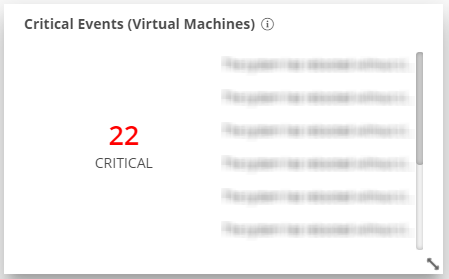
Shows critical events from the virtualization layer for the current timeframe.
CPU
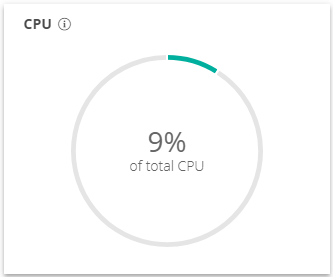
Shows the current combined average CPU usage for all appliances in the environment.
Application Performance
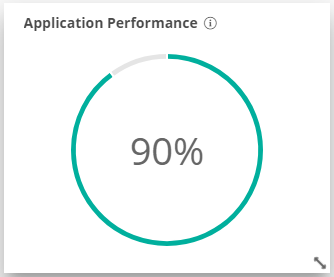
Shows the percentage of application starts that were completed within the set threshold over the last 2 hours. Powered by LoginPI.
Average % CPU usage vs previous days
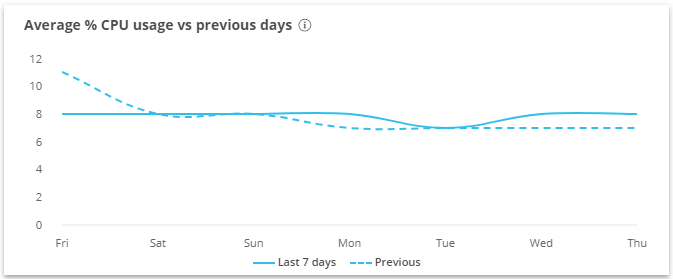
Shows CPU usage over the last 7 days. It can be compared to the same data from the previous cycle.
Bandwidth usage
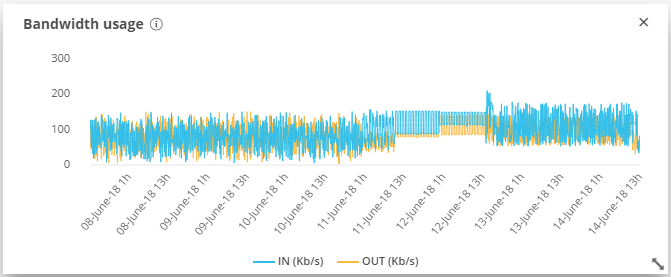
This Widget shows the I/O network throughput of Appliances in the environment over time.
Error Events (Appliances)
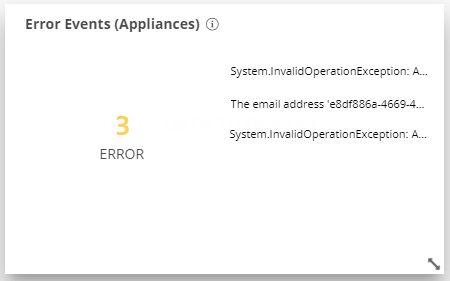
Shows the error events from the physical layer for the current timeframe.
Error Events (Virtual Machines)
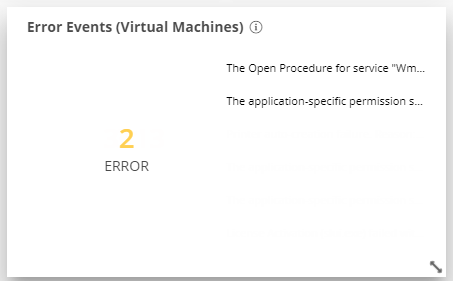
Shows the error events from the virtualization layer for the current timeframe.