The VDI OS Manager contains this feature to visualize and analyze your data information. These dashboards allow the user to track the user experience (UX) and the platform. Each widget shows different metrics based on the key performance indicators (KPIs) related to the platform, the templates, the user experience, etc.
You must consider the tracked info belongs to the Historical data tables. So it is necessary to set up the Historical data to make the dashboards work correctly. If this is not set up, they will not show info. Please, refer to the Setup and Use of Historical data article for more information.
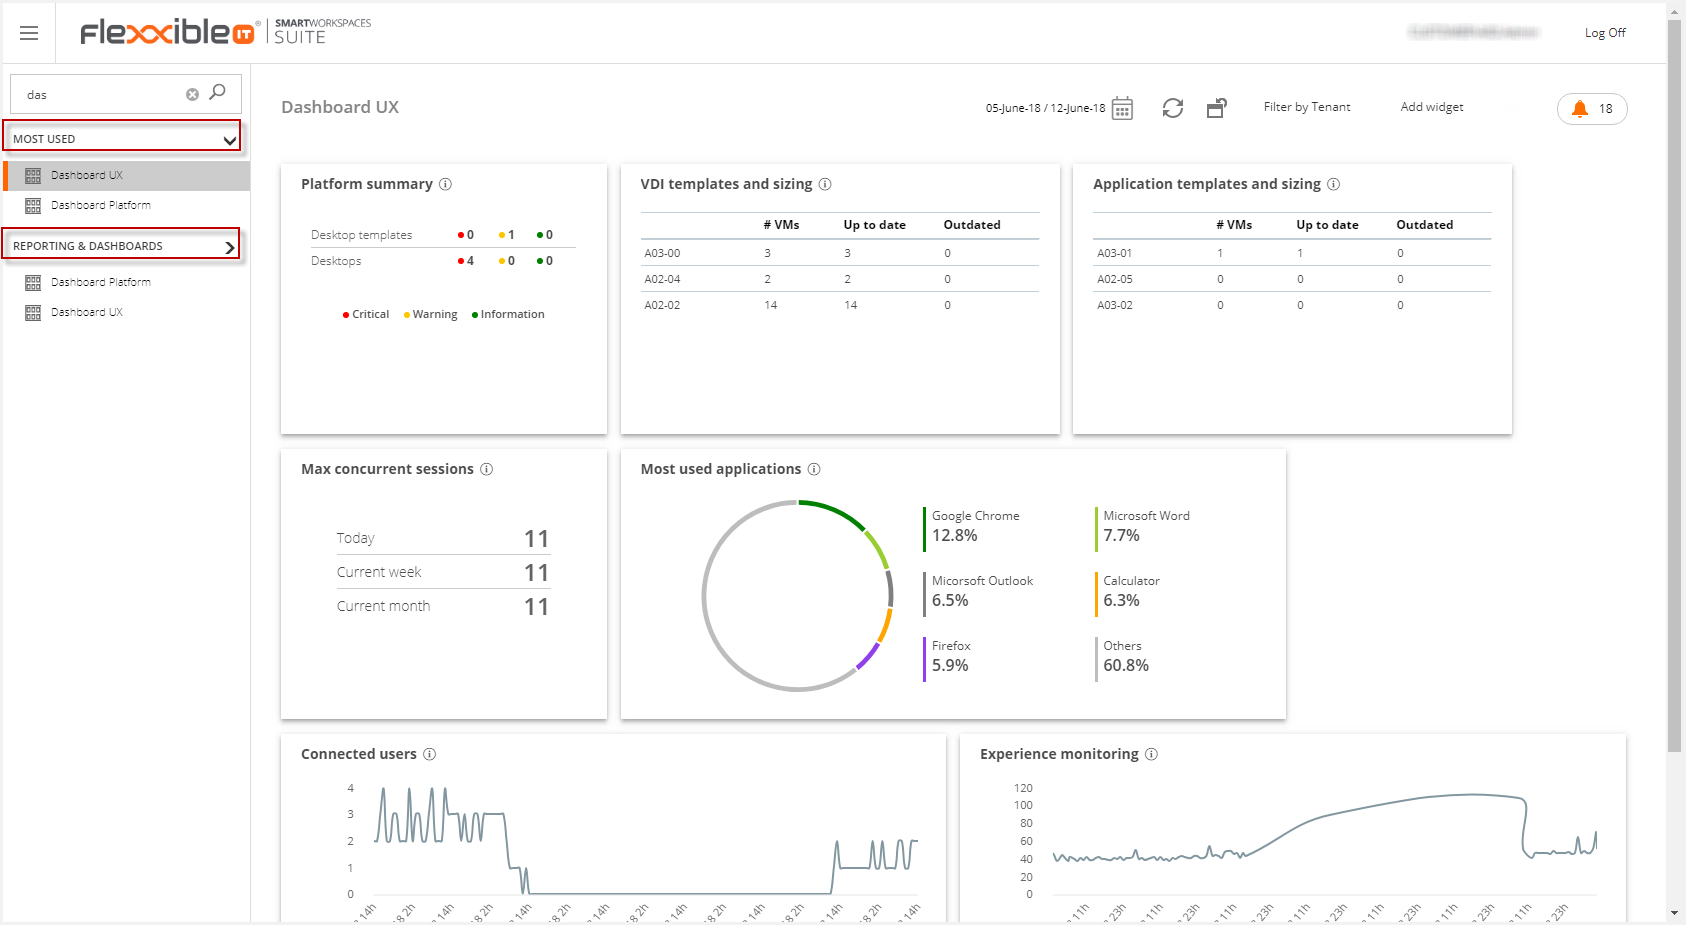
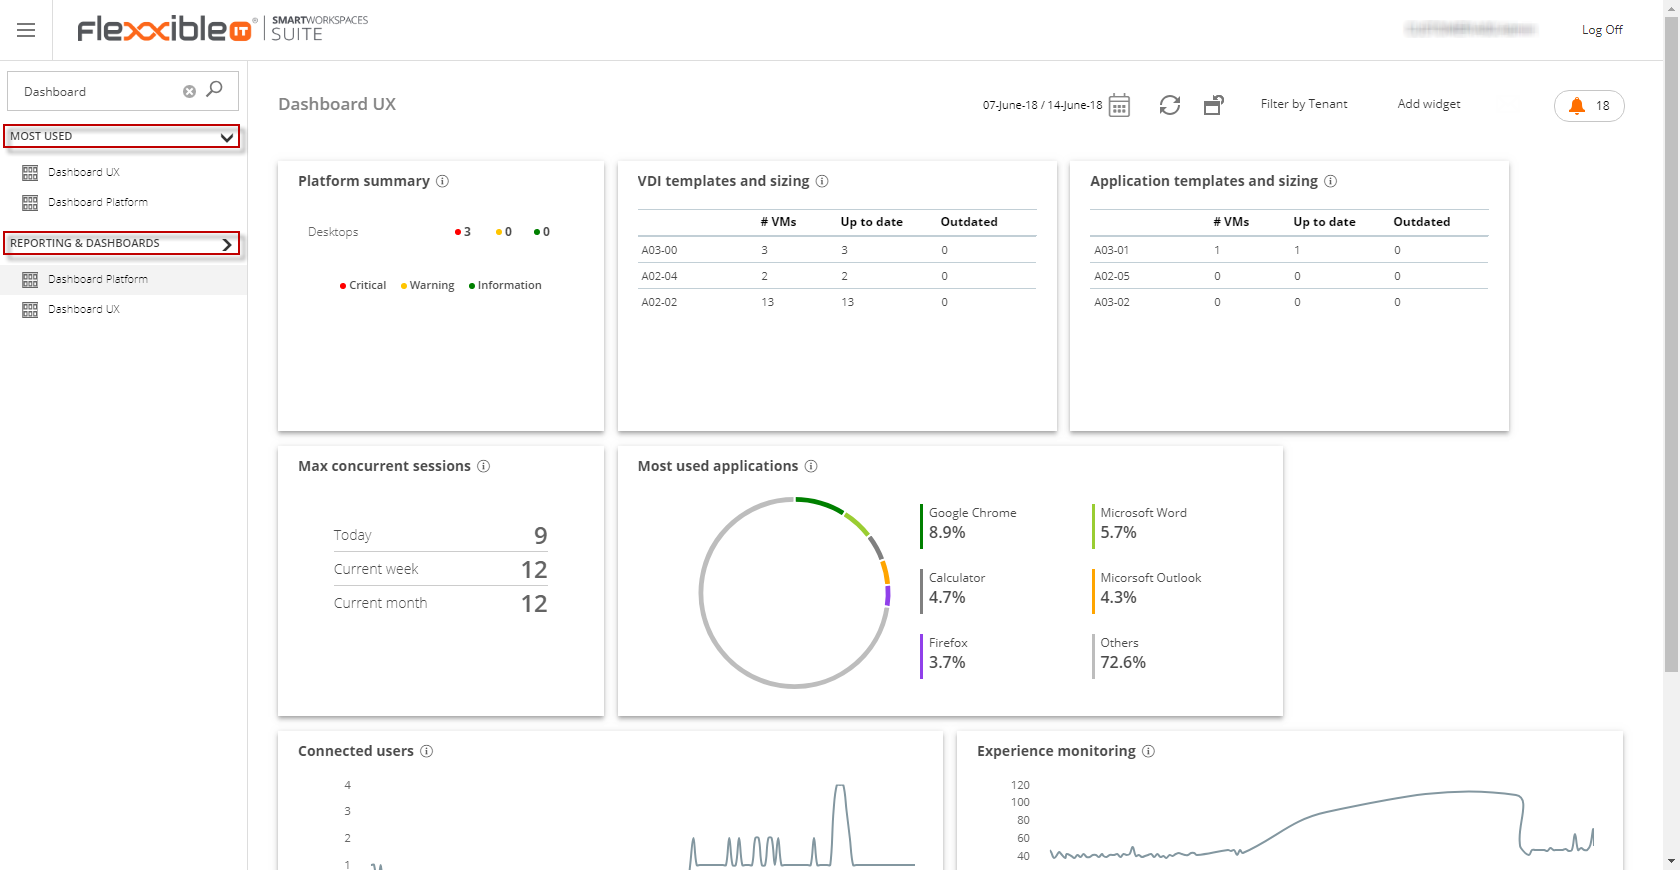
The Dashboard UX and the Dashboard Platform features are already available in the top of the most used functionalities and in the "Reporting&Dashboards" section.
Access to the Dashboard Platform is only allowed for administrators. This is the view for the other roles:
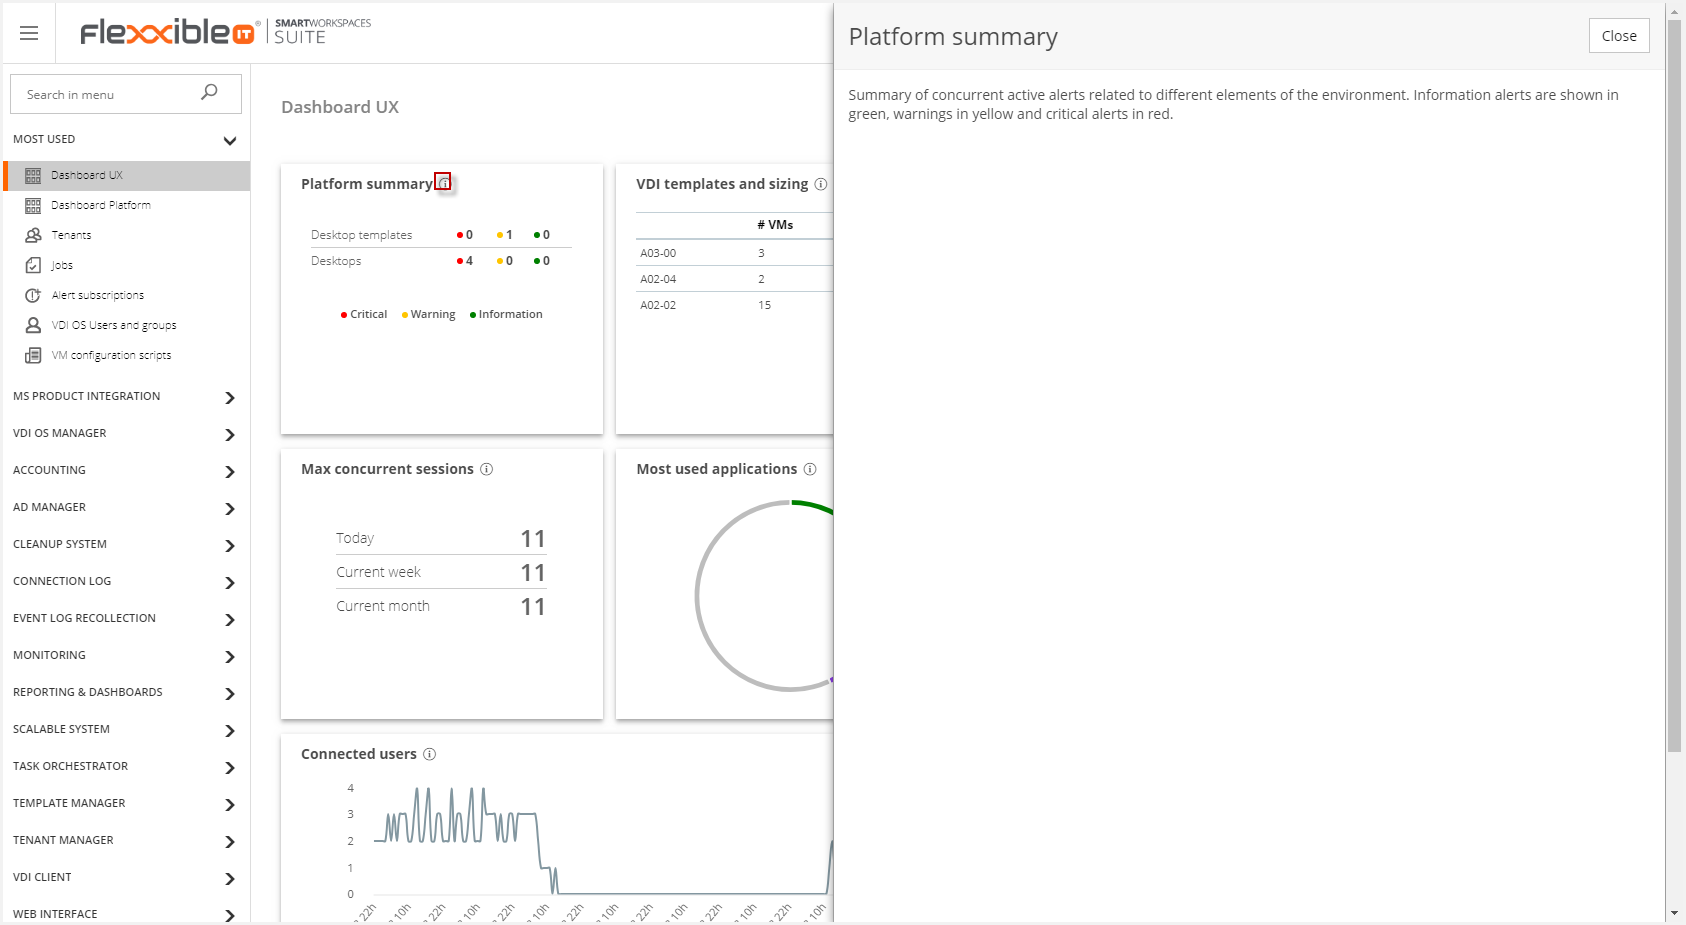
Each widget contains an "Information" ('i') button. This button displays the widget summary panel.
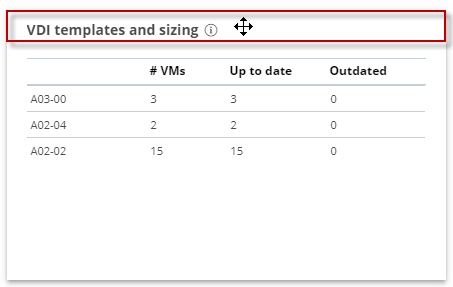
The position and the size of the widgets can be changed as follows:
- Position: Click in the top of the widget where it shows an arrow cross cursor. You may change the widget position dragging the widget within the dashboard canvas boundaries.
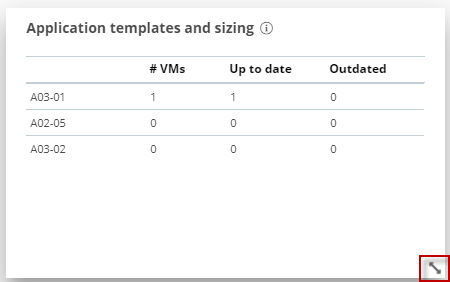
- Size: In the right botton corner appears a double arrow. You may change the widget size dragging the arrow.
The behaviour of the dashboards is similar. In the top side of the screen the user can find the following buttons:
- Date selector
- Refresh dashboard
- Reset dashboard
- Filter by Tenant
- Add widget
They will be detailed one-by-one below.
Date selector
The date selector of the dashboard allows to the user to apply a filter by date.
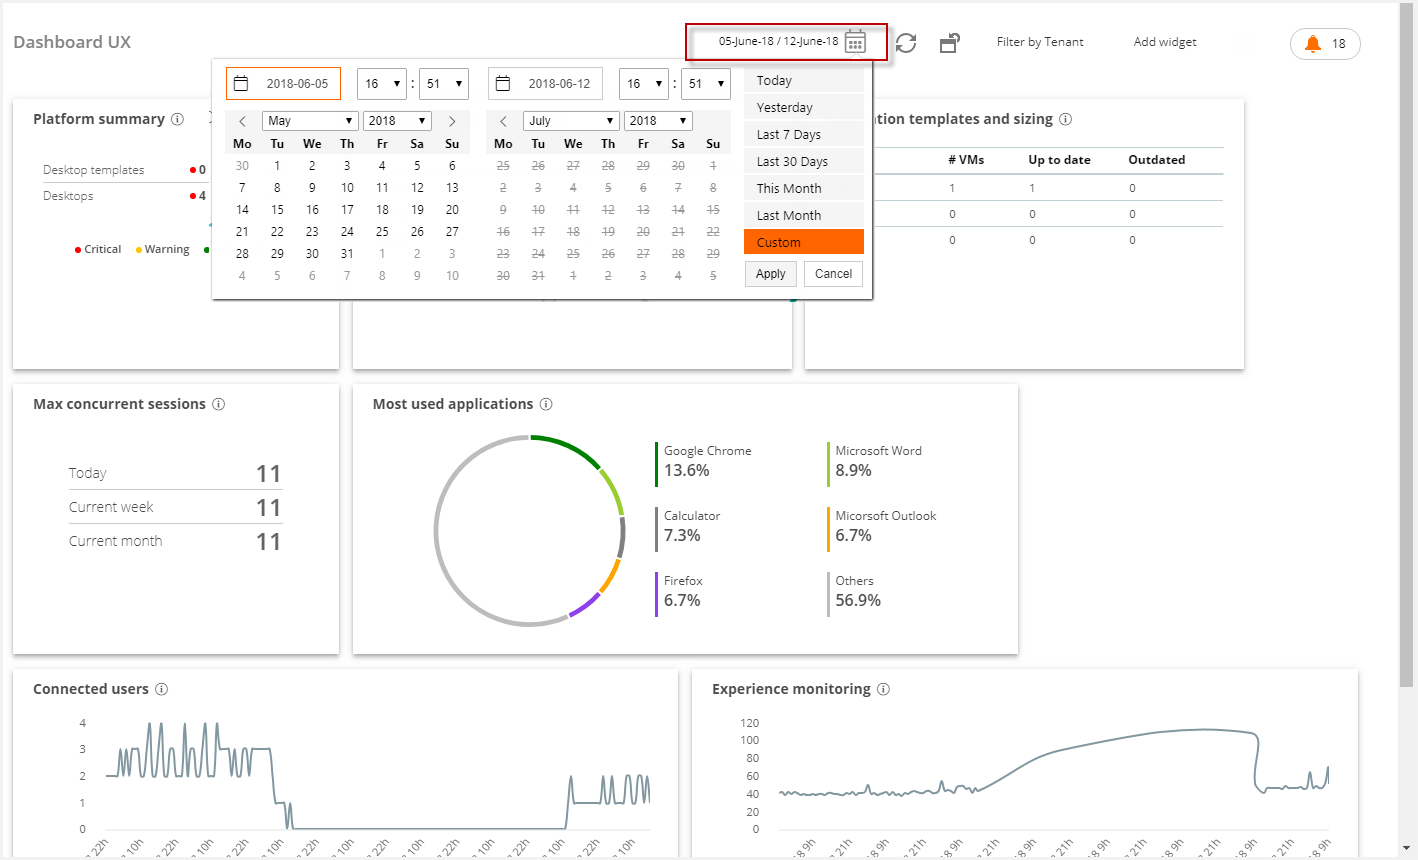
Although the user can select a interval of dates, there are some predefined filters:
- Today
- Yesterday
- Last 7 days
- Last 30 days
- This month
- Last month
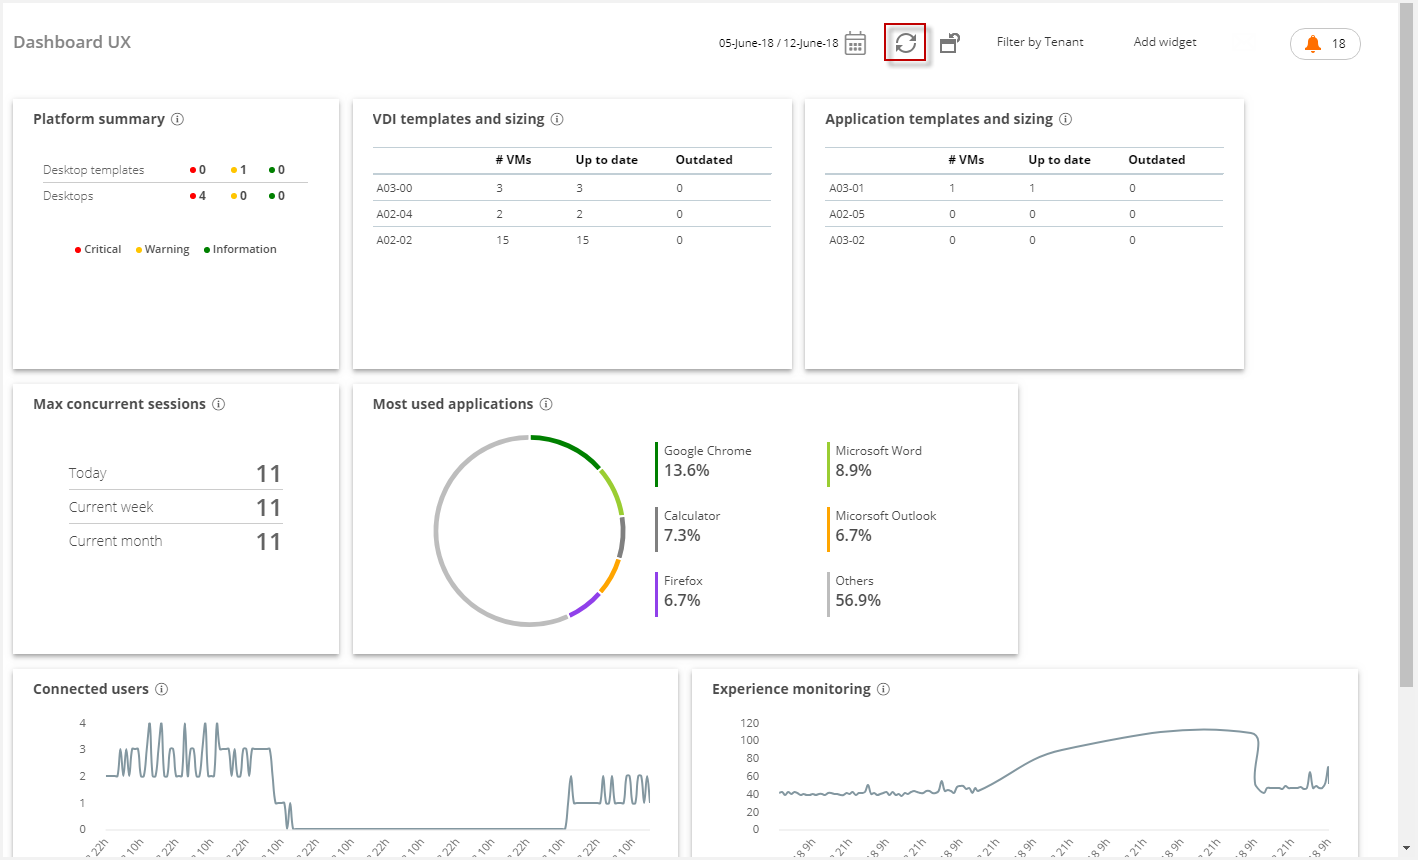
Refresh
The "Refresh" button updates the information of the widgets:
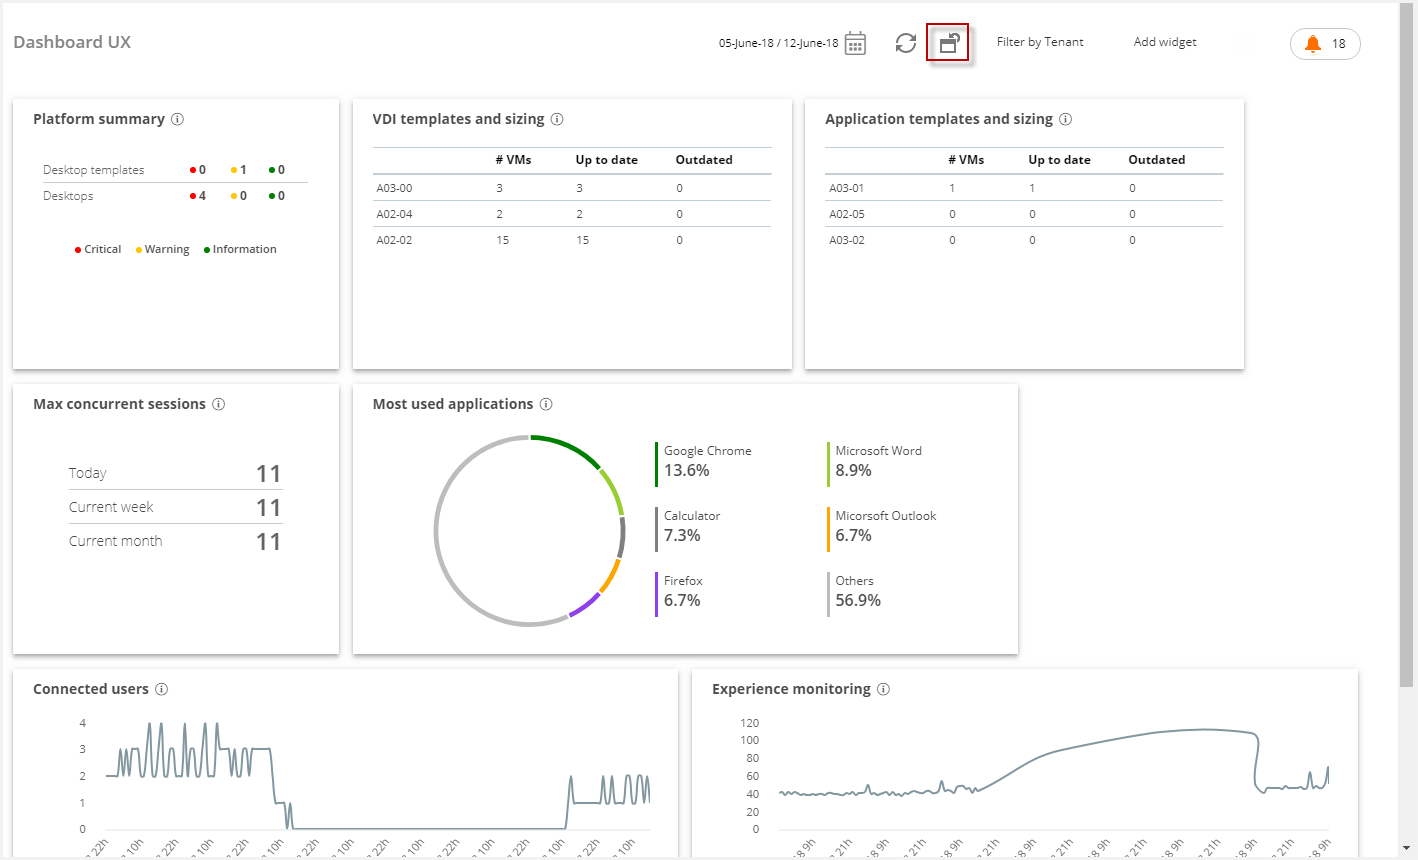
Reset all settings
This functionality allows the user to reset the configuration of the control panel, showing only the widgets loaded by default and in their initial position.
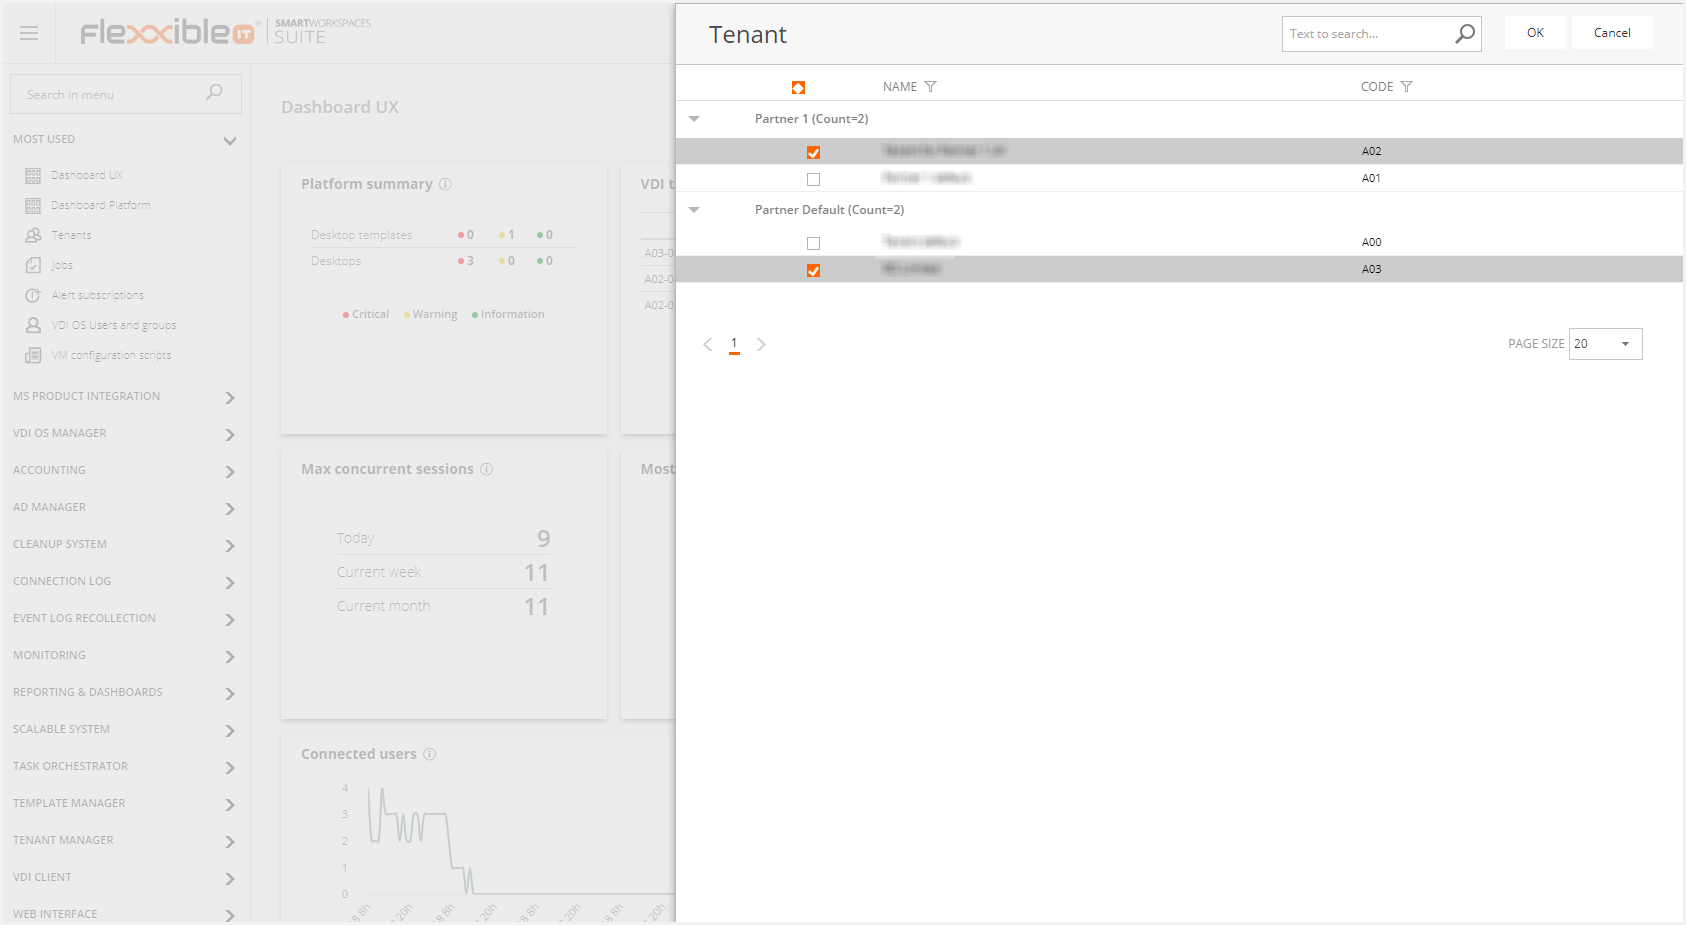
Filter by tenant
This filter is only available for the Dashboard UX. This allows the user to filter by tenant, showing the selected tenants or tenants.
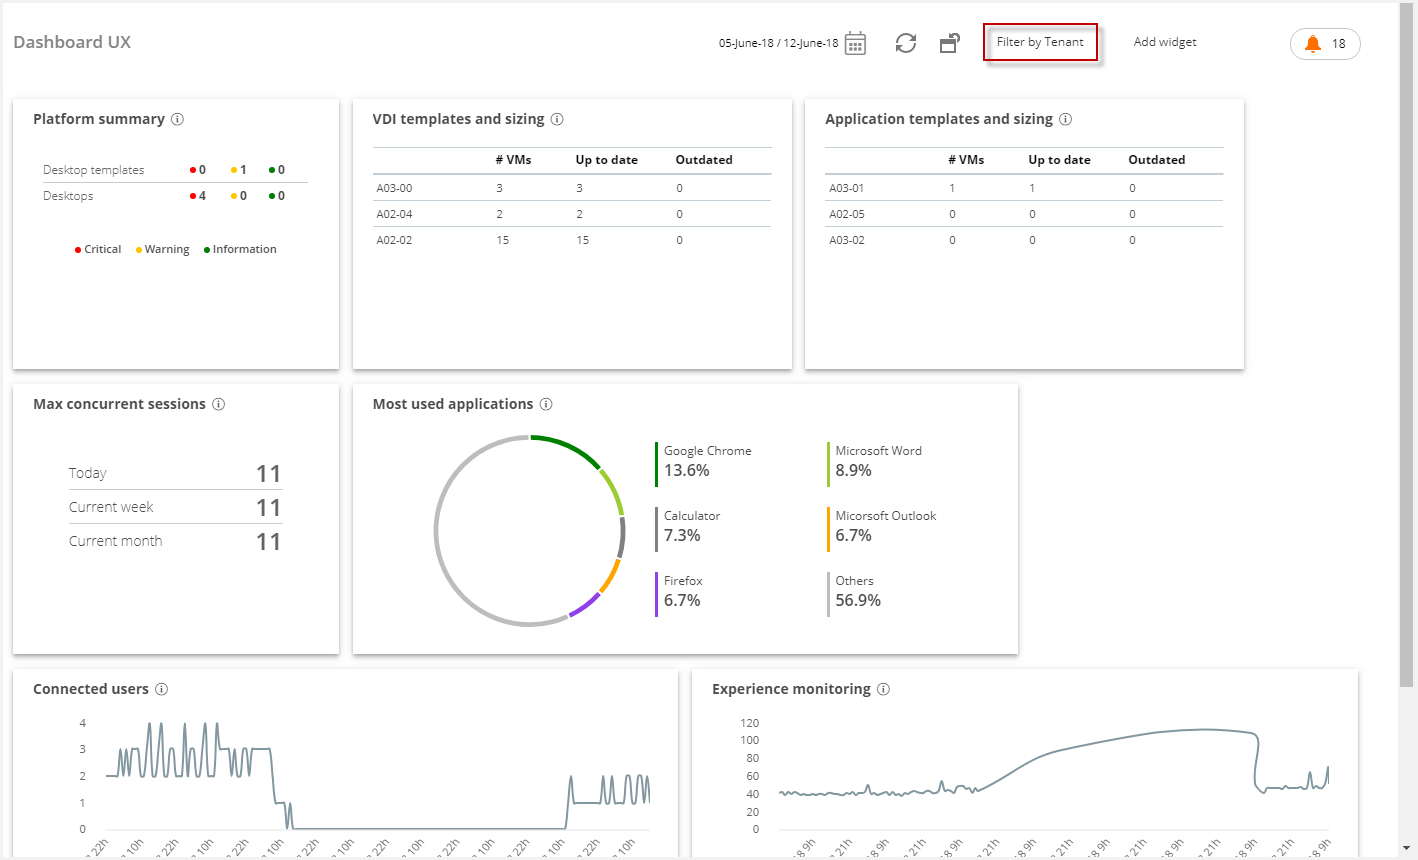
Please, click in the button "Filter by Tenant". The the list of available tenants for the logged user will be displayed. This allows to select various tenants.
 Add widget
This button displays the list of extra available widgets to load in the dashboard.
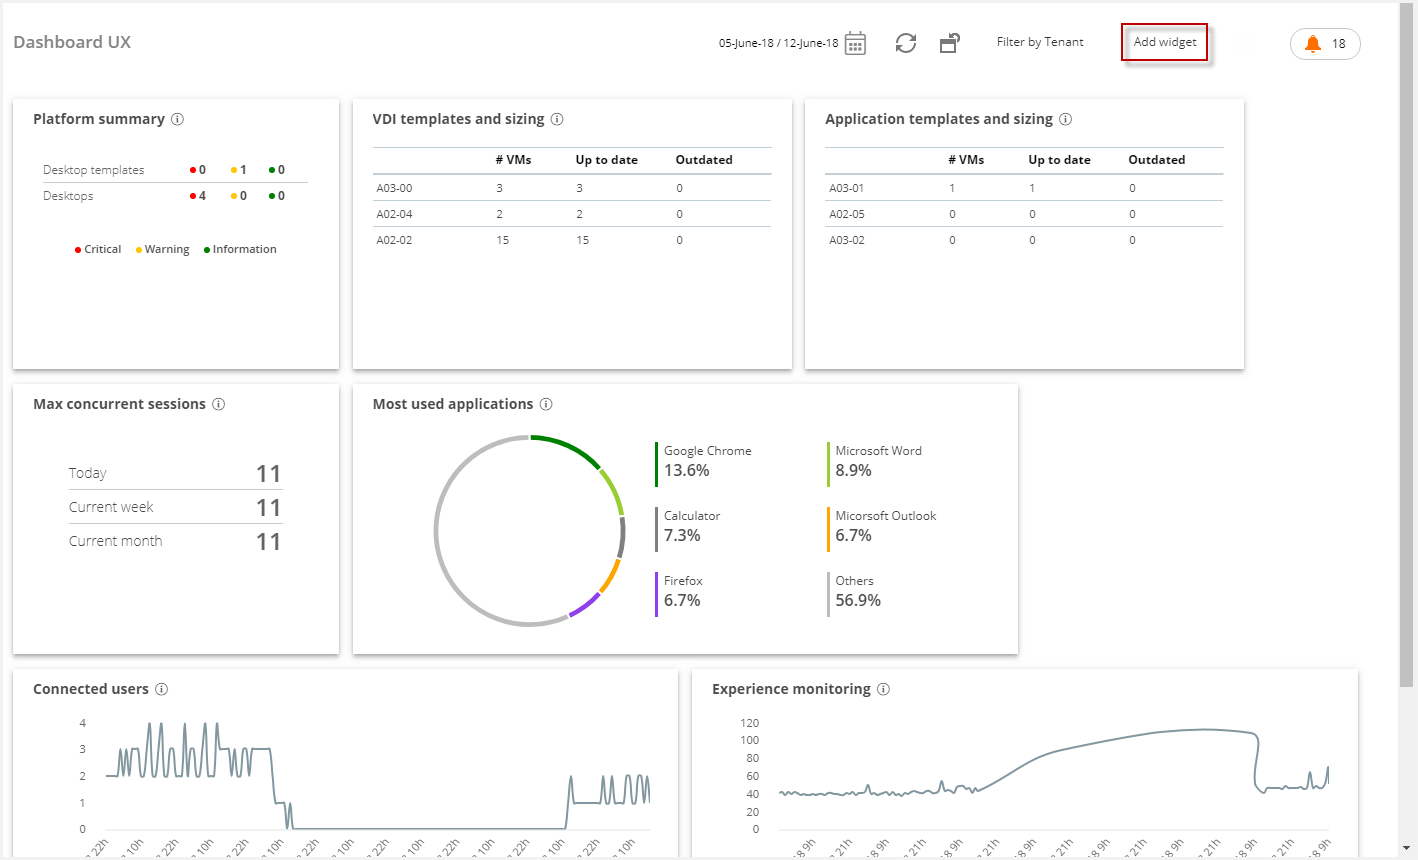
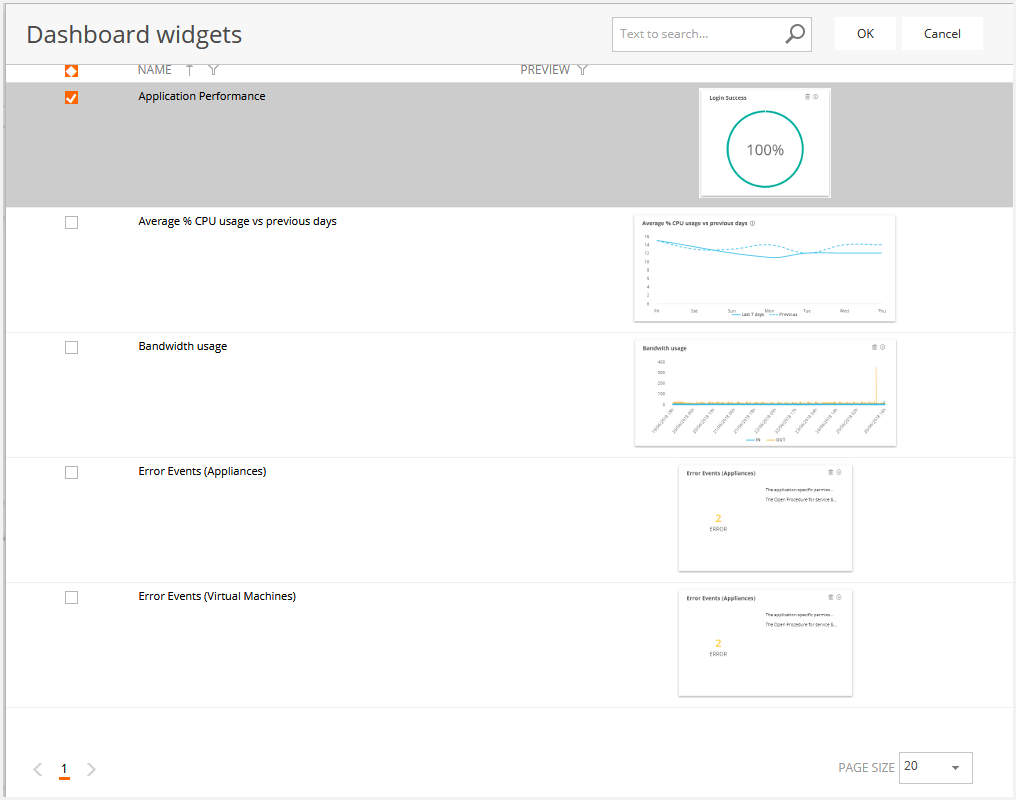
Select the desired widget and click in the "OK" button, so that the widget is displayed in the botton of the dashboard canvas. This list allows multiple selection.