Flexxible|SUITE SmartWorkspaces is able to store data related to the users' resources activities. This functionality is supported by the "Reporting&Dashboards" module. It is located on the left side menu as indicated in the screenshot below.
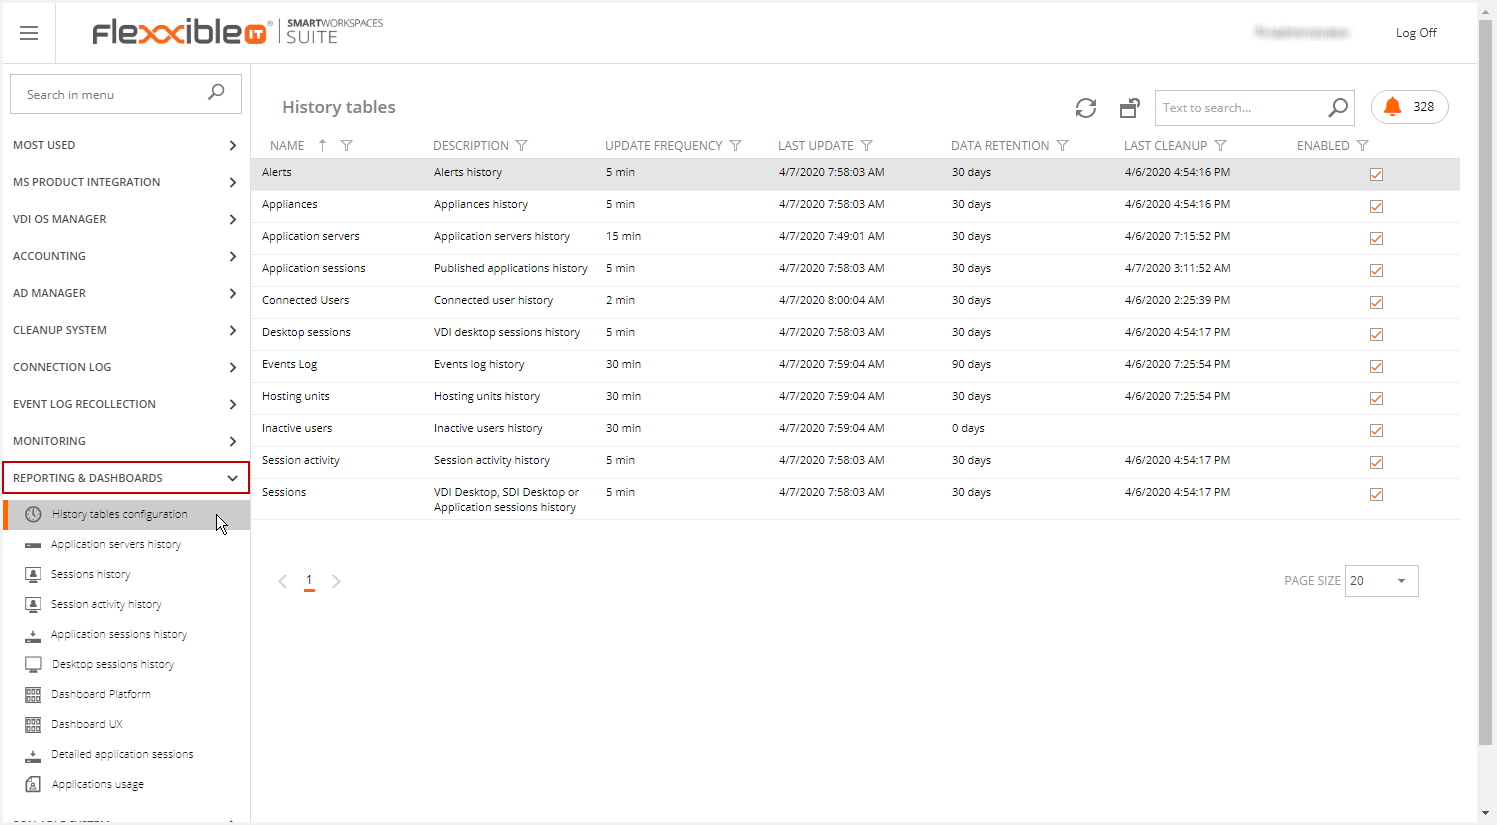
In the "REPORTING & DASHBOARDS" group you can see the following components:
-
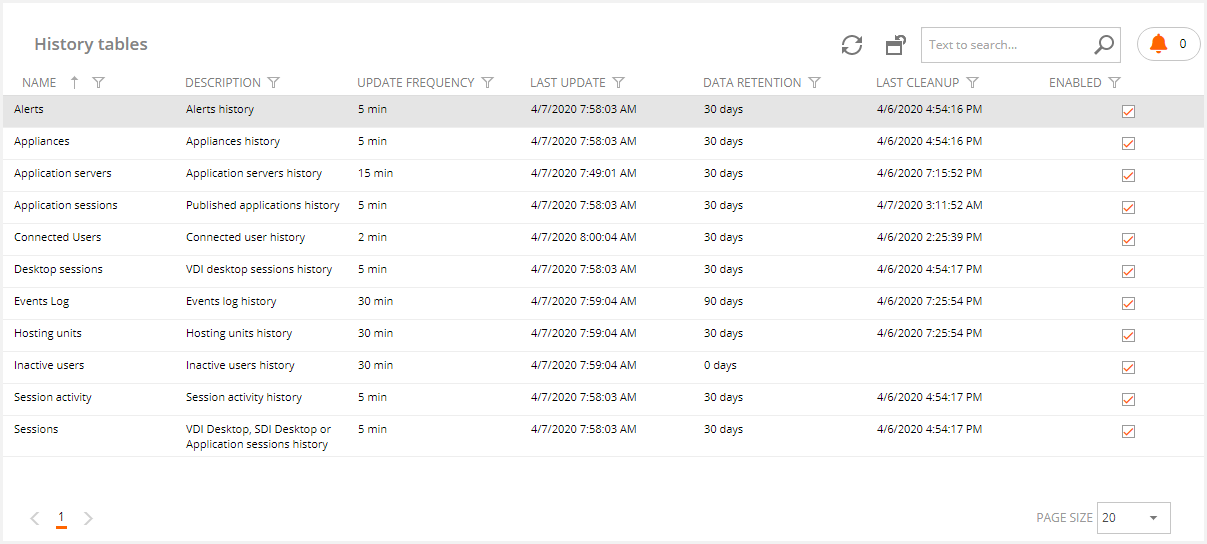
History tables configuration: In this session, you can enable or disable the data gathering mechanisms separately for each one of the functionalities indicated above from 1 to 5. The available options for the History tables area configuration are shown below:
- Enable or Disable the automatic data collection. This option is disabled by default.
- Specify a value for Update frequency, which will be the time interval used to perform data capture.
- Establish historical data retention through the Data Retention option which can be used to specify the history of the captured data for analytical purposes.
- Application servers history: This view illustrates the usability of the application servers at different time intervals. This way you can analyze them separately. Hence, you can group them by different categories(ASF, DG, etc).
- Sessions history: By clicking on Sessions history, the user can see the different pre-filtered data sources related to the sessions' occurrence in the environment. The sessions are grouped by different types (VDI, SDI, and PublishedApp). Thus, the data can be filtered by type and also by different temporary values.
- Session activity: Allows monitoring new, closed and active sessions over time.
- Application sessions history: This option displays a filtered view of all the PublishedApp sessions.
- Desktops sessions history: Here you can see the VDI sessions concurrency at different time intervals, filtering by any component of a session of this type.
- Dashboard Platform: Please refer to the Dashboard Platform and Dashboard and data analysis articles.
- Dashboard UX: Please refer to the Dashboard UX and Dashboard and data analysis articles.
- Detailed application Sessions: This option displays a pivot table with the application's usage information.
- Applications usage: Displays applications usage by users on a day-by-day basis.
Configuring and Activating the Data Collection
By default, the data collection would be disabled. For this reason, the initial configuration is necessary. See screenshot below:
Click on any of the available options:
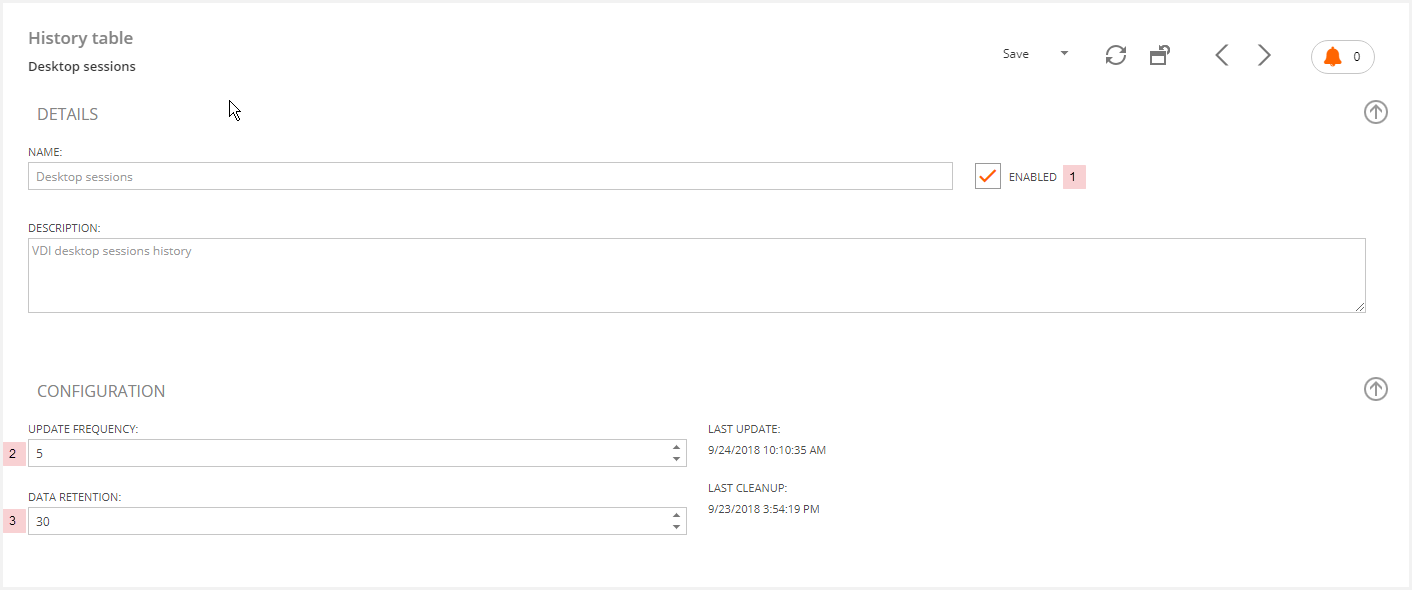
To activate and set up this functionality you need to:
- Enable the desired table.
- Set up the DataBase Update Frequency. In other words, set the desired time interval for data gathering.
- Specify the value "Data Retention". This means how long history will be kept.
The fields "LAST UPDATE" and "LAST CLEANUP" are read-only access. Their role is to show the timestamp of the last data gathering event and also the timestamp of the last time an automatic data clean up was issued.
Using the Collected Data
The way to operate with the collected data is similar for all sessions. It is based on the way you operate using pivot or dynamic tables. It is also possible to generate data traffic from the resulting data and export the info included in the tables.
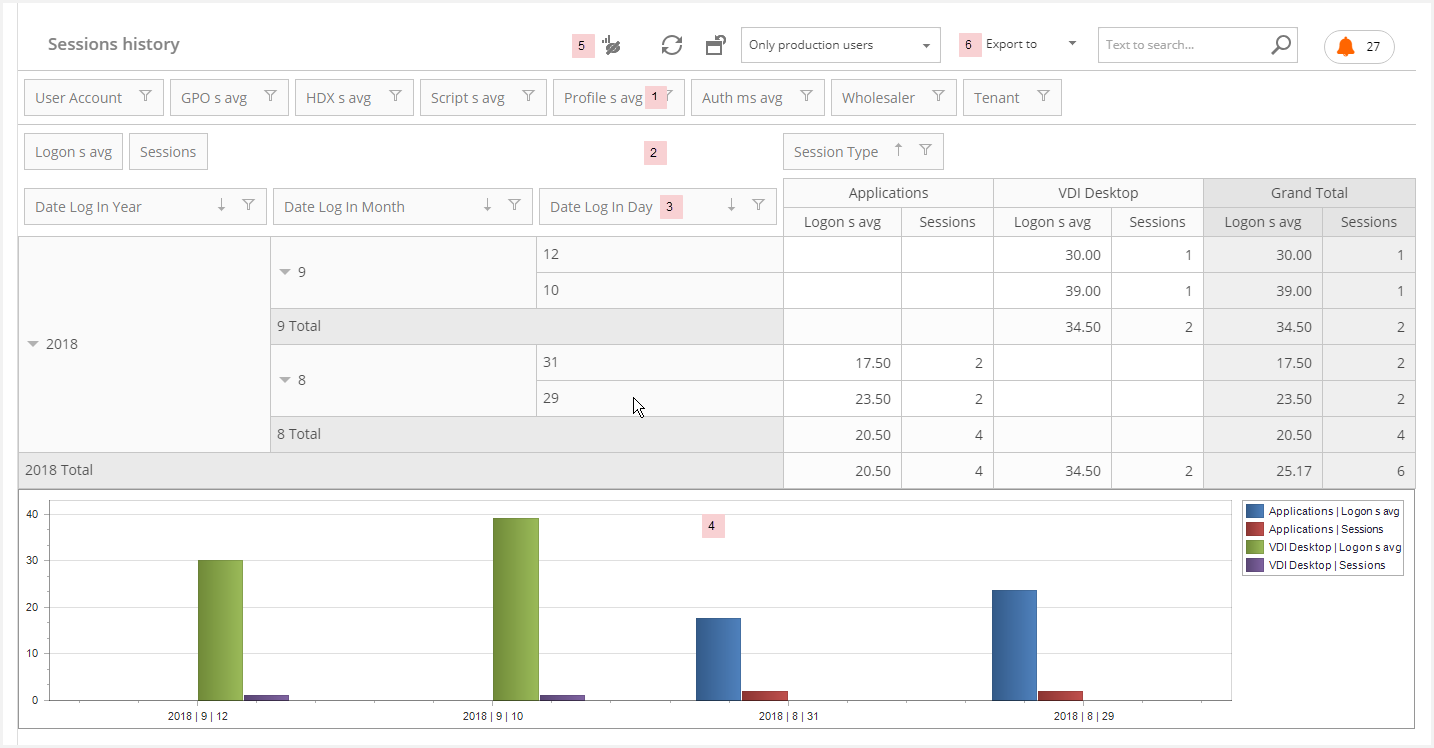
You can see the following sessions in the Dashboard view:
- Available data can be included in the report. The upper horizontal bar includes the data with the largest rate of usability in the dashboard.
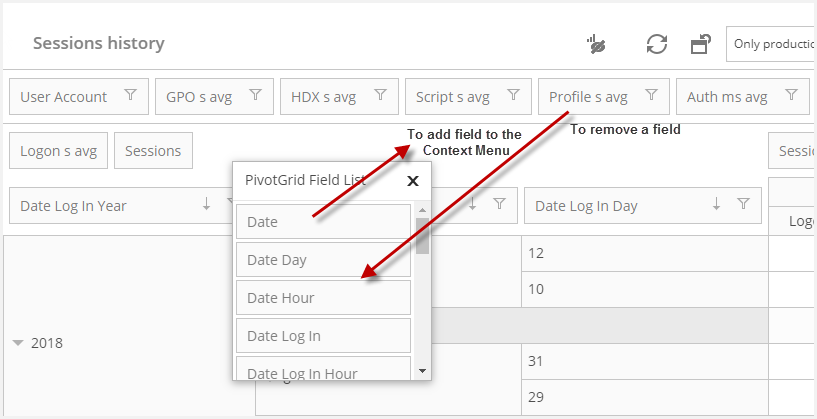
- It is possible to add and remove data from this session by performing right click and activating the "Field List"
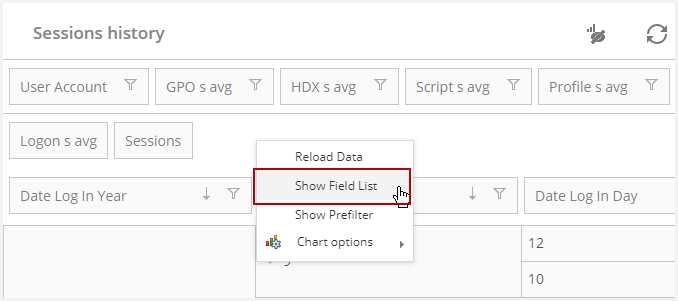
- To add a field from the Field List, you just need to drag it from the PivotGrid Field List to the context menu. Do the opposite if you want to remove a field.
- It is possible to add and remove data from this session by performing right click and activating the "Field List"
- Show the Prefilter option. Any data you would like to plot in an X-Y axis chart should be dragged into this session. The right column represents the X-axis and the left column represents the Y-axis of the resulting chart.
- Data to be included in the table. In this session, you can drag and drop all the data you want to include in. Also, you can sort it out according to the filter you wish to apply.
- Chart Options. This is where the data traffic will be generated based on the available data. In order to get the chart displaying any information, you should add some fields to the three data areas: Rows, Columns, and Data.
- Chart Activate/Disabled buttons.
- Export Button included in the Generated Table. Supports data export to several file formats. The recommended format to export data in MS Excel because of its high compatibility and familiarity.
History Tables volume simulator
Next, you can calculate an approximate max size for each history table.
You must consider your DBA must adjust these values in function of the DB exploitation.
History table: