IT help desks now have a single console for access to critical data enabling faster operational support to users and removing the need for escalation to higher level engineers. The tool provides status analysis of the user session and the virtualized resources, the ability to make remote connections and customize operations for remote configuring or troubleshooting.
This article is focused on showing the specifics tools provided to support users running VDIs.
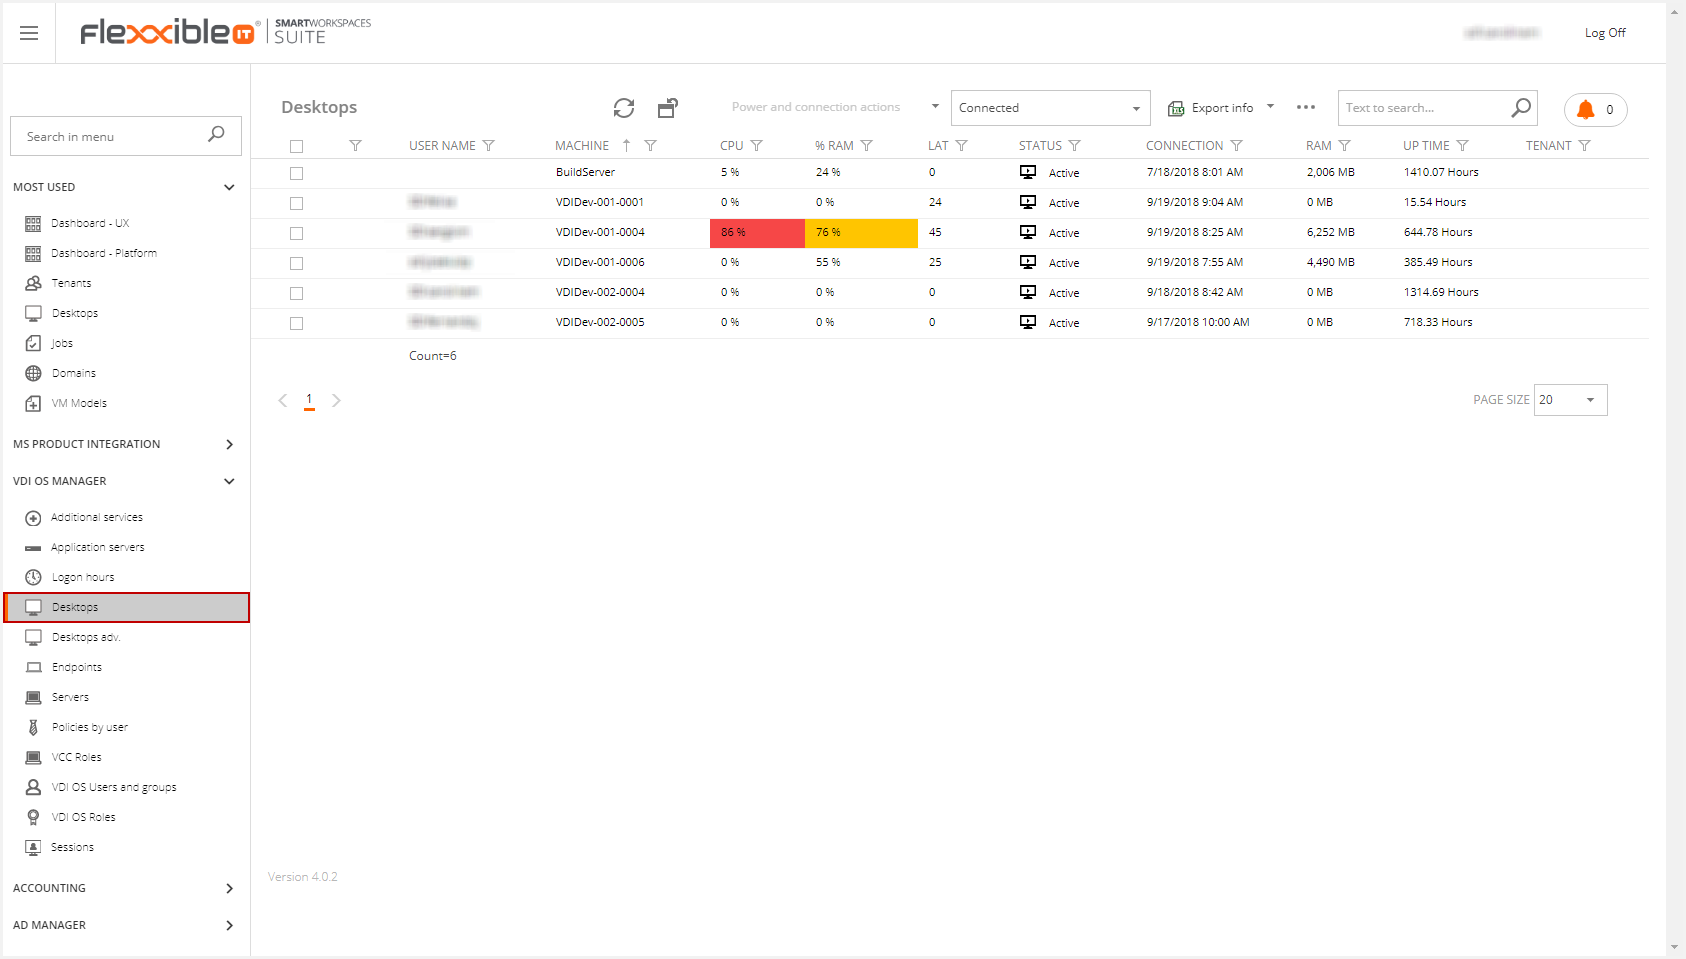
You can access to the Flexxible|Help Desk tool through the Desktops menu option of the VDI OS Manager group in the navigation menu.
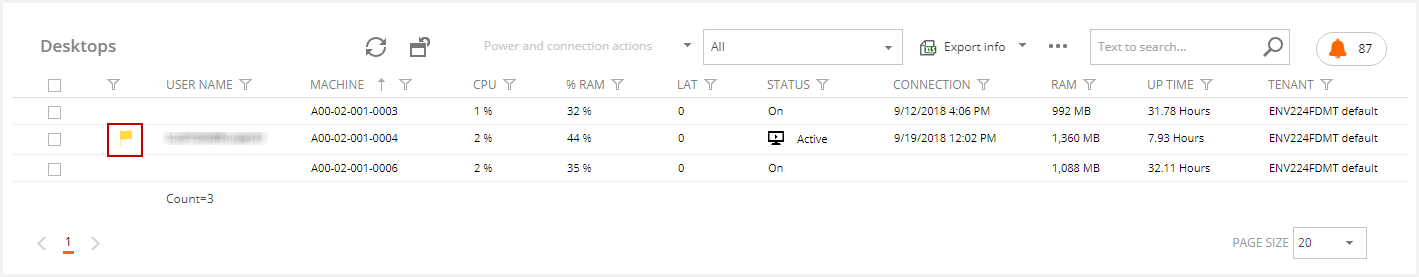
Desktop list
The desktops list provides an overview of all available desktops (VDIs) on the infrastructure.
This section is specified design to help desk tasks. This focus the most habitual operations that are carried out from this department, allowing a simple management (e.g. fast export of lists).
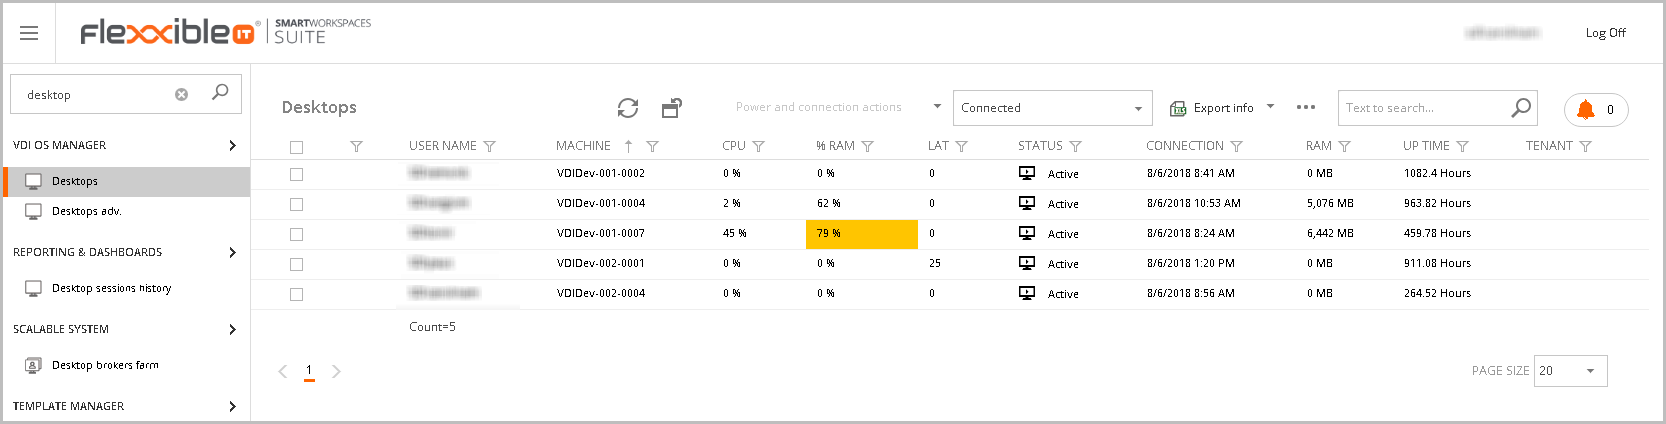
You can see the connected desktops by default. You can select all desktops or filter by the search criteria you need. Please, visit the Customizing Lists and Data Export article for more information.
On the other hand, you can configure CPU, RAM and latency threshold values to diagnose problems in the machines. Through a quick view you can see the machines with warning or critical values.
The desktops list shows by default the following information:
- User name: The connected user name, using the domain/user pattern.
- Machine: The desktop name.
- CPU: The percentage of current CPU usage. To configure the threshold values you must set in the settings section the following parameters:
- ThresholdCPUWarning: Show column CPU yellow color while the value of CPU is over threshold. The default value is 50.
- ThresholdCPUCritical: Show column CPU red color while the value of CPU is over threshold. The default value is 70.
- % Ram: The percentage of current RAM usage. To configure the threshold values you must set in the settings section the following parameters:
- ThresholdRAMWarning: Show column RAM yellow color while the value of RAM is over threshold. The default value is 50.
- ThresholdRAMCritical: Show column RAM red color while the value of RAM is over threshold. The default value is 70.
- Lat: The latency. To configure the threshold values you must set in the settings section the following parameters:
- ThresholdLatencyWarning: Show column latency yellow color while the value of RAM is over threshold. The default value is 100.
- ThresholdLatencyCritical: Show column latency red color while the value of RAM is over threshold. The default value is 350.
- Status: The desktop status (ready, active, disconnected, off, on, unregistered or in maintenance).
- Connection: The last date of connection.
- Ram: The current RAM in use.
- Up Time: Hours of activity from the last restart.
- Tenant: The desktop tenant name.
Selecting one or more of the desktops in the list, you can perform the following operations:
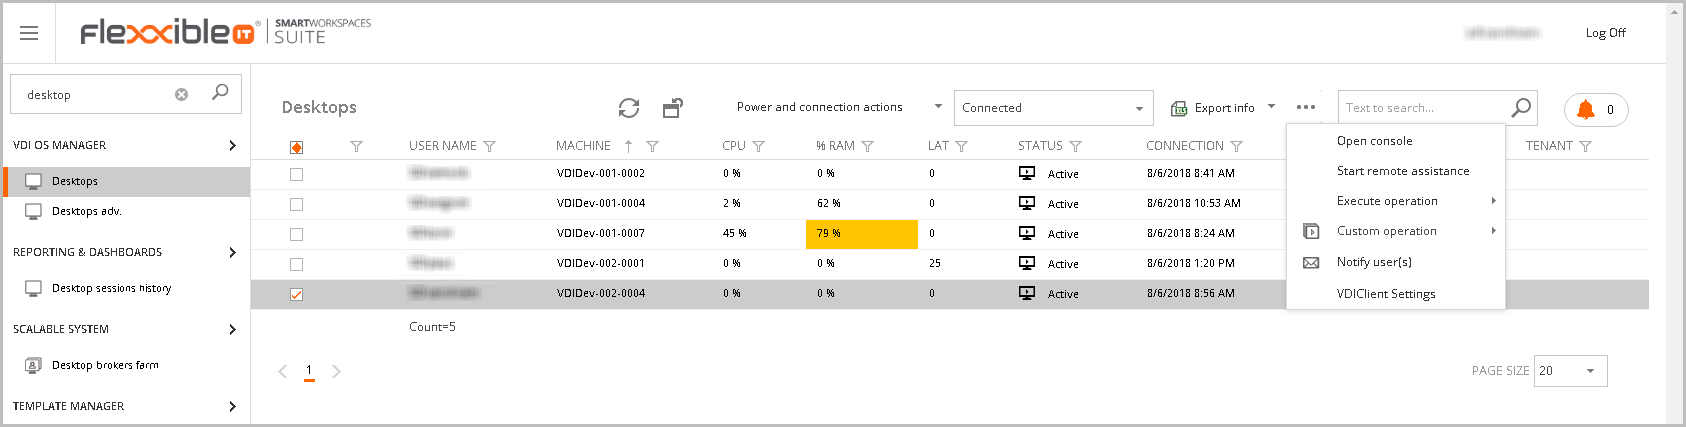
- Power and connection actions
- Export info
- Open console (only available if just one desktop has been selected)
- Start remote assistance (only available if just one desktop has been selected)
- Execute operation
- Custom operation
- Notify User(s)
- Search
Next, this actions will be described.
Power and connection actions
The power and connection actions that you can perform are the following: Turn on, shut down, restart, log off, disconnect, power off and force restart.
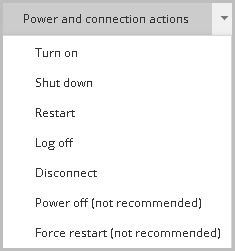
As easy as select the desktop and the action, this will perform the action for the selected desktop. This will display a confirm message. When you confirm, this will create a job executing the operation in the desktop.
The actions of Restart of Shutdown and Force for the loss of data that this may imply are indicated as not recommended.
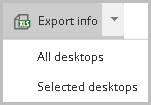
Export info
This button allows to export the information in the grid into an Excel format file. If you want to see more information, visit the Customizing lists and Data Export article.
Open console
Click in the Open Console button displays a confirm message.
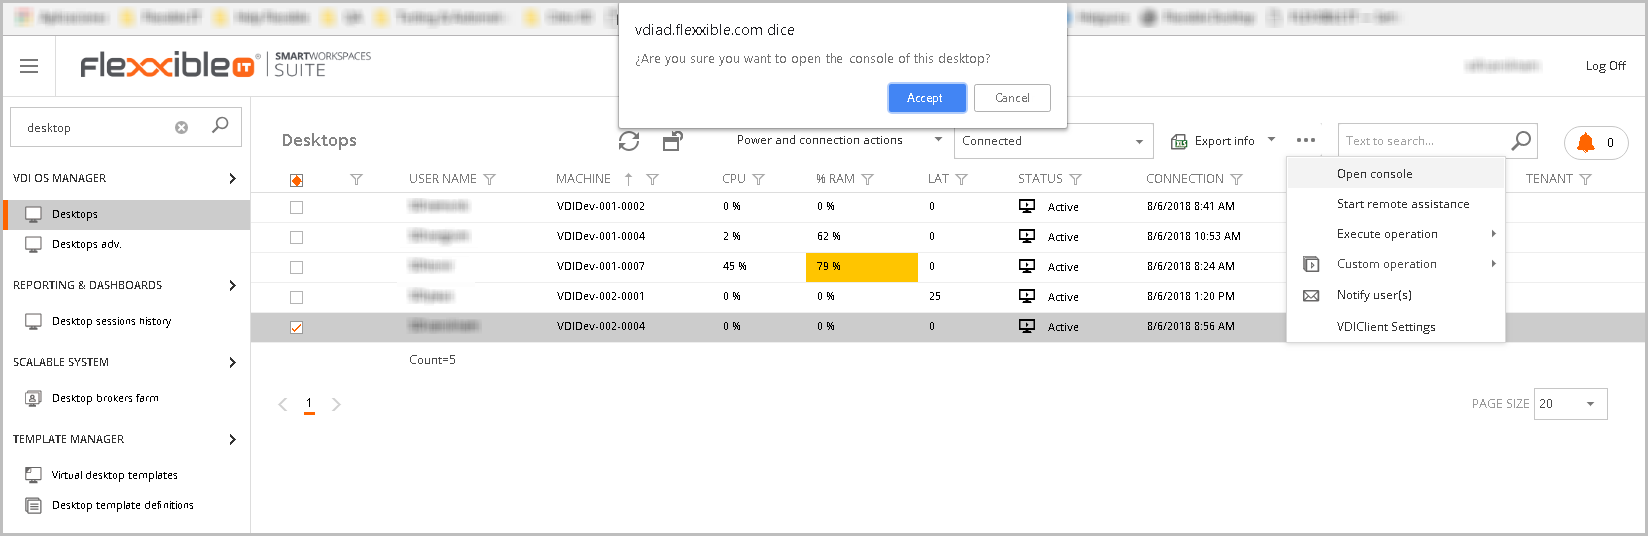
Click in the accept button will open the console.
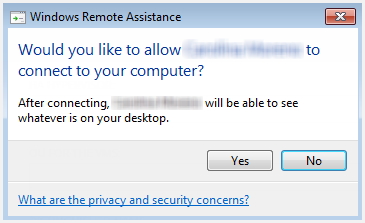
Start remote assistance
It allows the connection, via the Microsoft remote assistance tool, directly to the desktop, with the user's consent. This option downloads a remote desktop connection file to connect via rdp to the desktop.

Provides another point of entry to the desktop for diagnosis. The behaviour of a desktop can be different changing the origin of the connection and, in some cases, it will be necessary to use tools that give access to the physical PC source of the connection.
The remote assistance is only allowed from another desktop in the environment or from any desktop in the partner's environment.
When you select this option this will display a confirm message. Next this will generate an invitation (Invitation To - <desktopName>.<domain>.local). If you have the necessary permissions, this will open the remote assistance window. This message will be displayed in the desktop user session and must be consent to start the remote assistance.
Execute operation
You can perform through this option the next operations: assign flag, maintenance mode on, maintenance mode off, configure scheduled restart, change user, Reset VM (delete and create), delete user installed apps and delete VM.
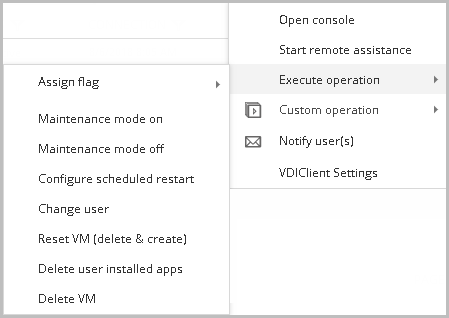
Next, this operations will be detailed.
Assign flag
In an active desktop with an assigned user, you can mark the user like VIP. Selecting the desktop and performing execute operation, assign flag, it will assign the selected (VIP or SuperVIP).
Please refer to the How to mark VIP users article for more information.
Maintenance mode on/off
Selecting these operations you can set on/set off the desktop in maintenance mode automatically. There is no necessary know the hypervisor that contains the desktop. Simply you can find the desktop searching by their user name (e.g.), select it and perform the operation. When you confirm, this will generate a job that will change the maintenance mode.
Configure scheduled restart
You can configure a scheduled restart to the selected desktop. Selecting this operation will display a modal window with related information.
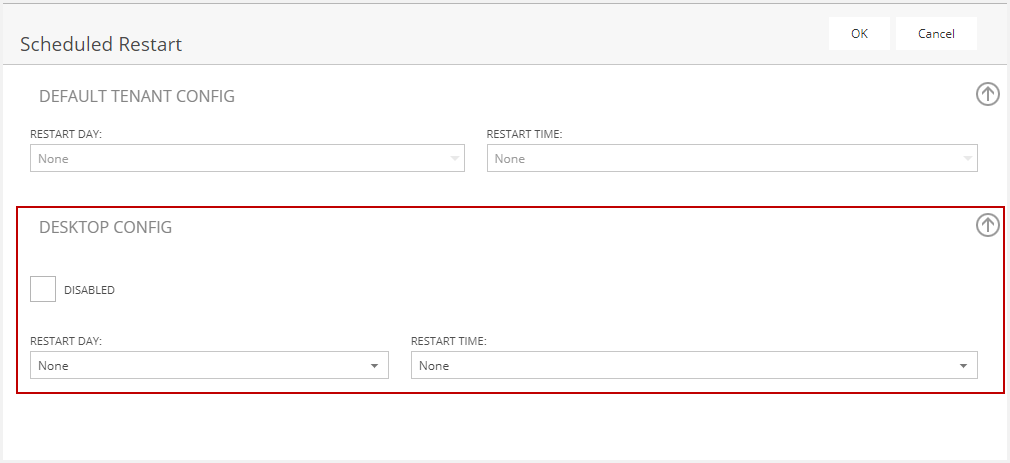
This window shows the default tenant config (restart day and restart time) and the desktop config section. In this section you can set the desktop restart day and time and the option of disabled the scheduled restart if necessary.
You can enable or disable this feature modifying the EnableScheduledDesktopRestart setting.
Change user
This options allows you to change the machine user for persistent or customizable VMs. Checking the desired desktop will display a confirm message. Then it shows this modal window where you can change the user. Click in the search button will display the users directory. You can select and press ok.
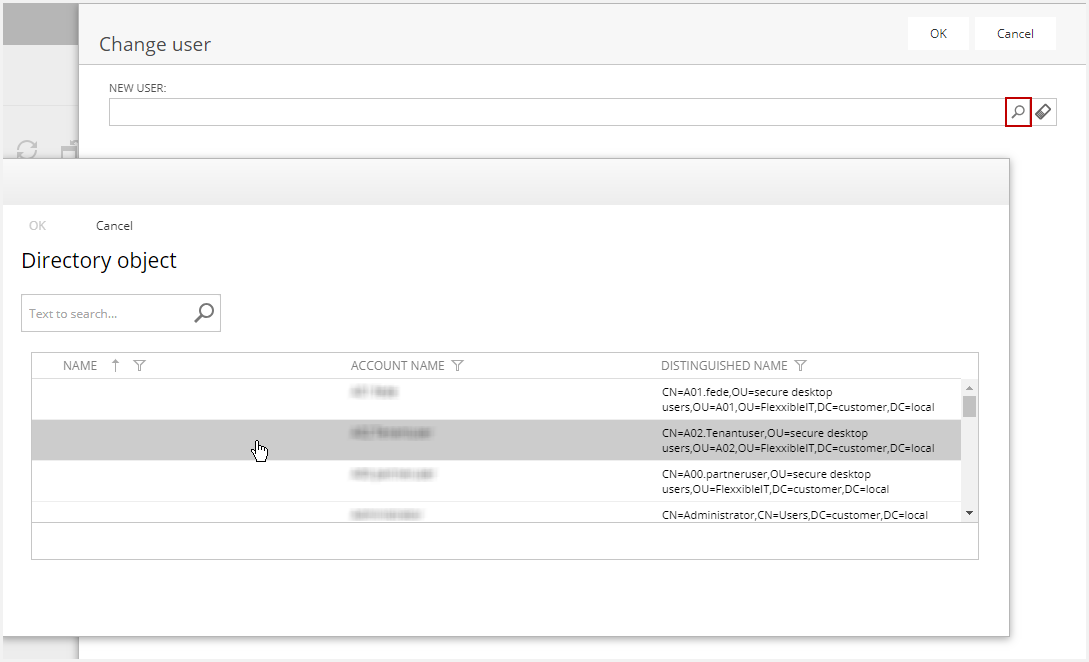
Then a job is generated and the user is assigned in a few minutes.
Reset VM (delete and create)
This operation reset the VM, deleting and creating a new VM machine based in the corresponding template. To execute this operation, the desktop must be stopped and/or in maintenance mode.
To perform this operation, the create and delete computer accounts permissions must be granted in the desktop domain. Otherwise, computer accounts will not be removed from AD.
Checking this operation a job is generated and the virtual machine is reset in a few minutes.
Delete user installed apps
The VMs selected for this operation must be stopped and/or in maintenance mode. It must also be a customizable type.
The customizable desktops structure is composed by a base disk and a differential disk where the user changes are stored (installed apps). This operation generates a job that erase the differential, removing all the user changes (including the user installed apps). So the desktop returns to the initial state
Delete VM
The VMs selected for this operation must be stopped and/or in maintenance mode. This generate a job that deletes the desktop previous a confirm message.
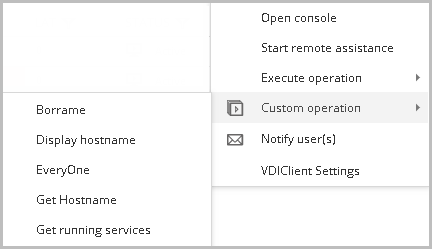
Custom operation
The custom operation are scripts that allow remote execution on one or more desktops. This allows very fast installation of the package until the insertion of registry keys. It can be accessed from the VDIOS Manager.
In required, Flexxible can create a custom operation and give access to the partner to execute it on the desktop(s) that needs it, it is also possible to delegate the creation of the same to the partners.
It is also possible to give permissions to tenant users to execute the custom operation.
You can perform any defined custom operation in the selected desktop.
Please refer to the Custom Operations article.
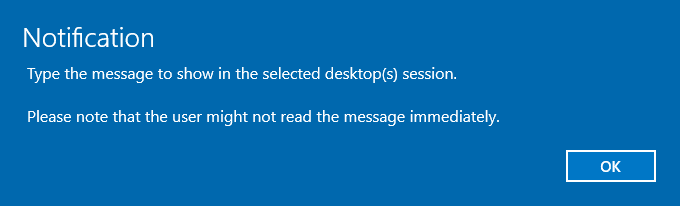
Notify user(s)
You can notify user by this functionality. Selecting the desktop(s) will open a modal frame and you can send the desired message to the user(s).
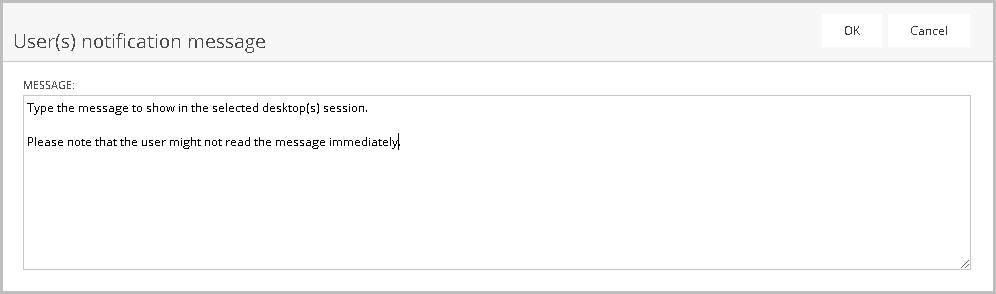
Typing the message an clicking the OK button, the message will be sent.
VDIClient Settings
This option opens the quick setting modal window to configure for this desktop.
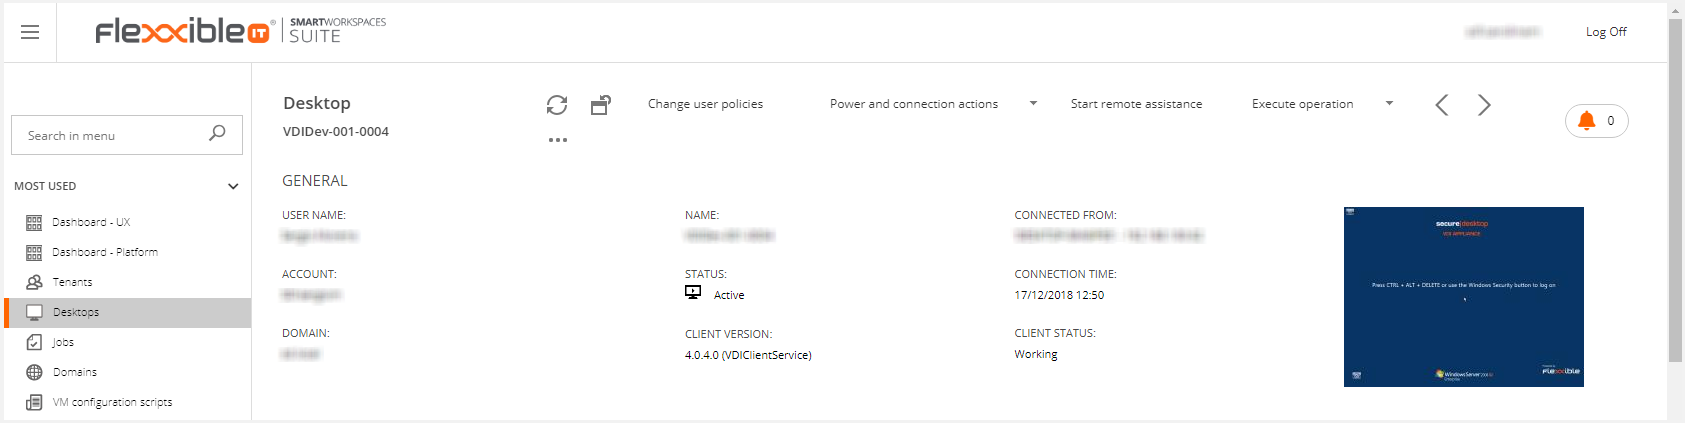
Desktop Detail
The desktop detail view is where you'll find all the needed information to support end users, perform additional actions on it, monitor the current performance with more detail, etc. On the first group of fields, information about the desktop (general, extended, performance, etc.) is provided and some additional operations are available, as follows:
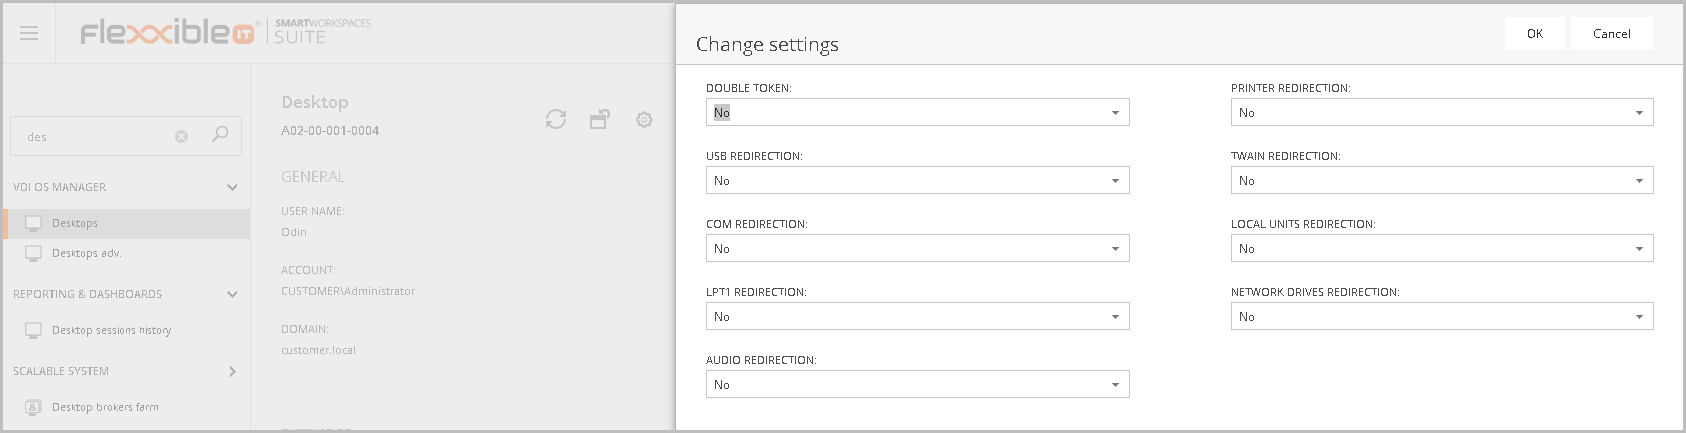
- Change settings: This view allows to resize the desktop resources. Clicking the change settings button, shows a modal window. You can change the following settings:
- Number of CPU Cores
- Amount of RAM
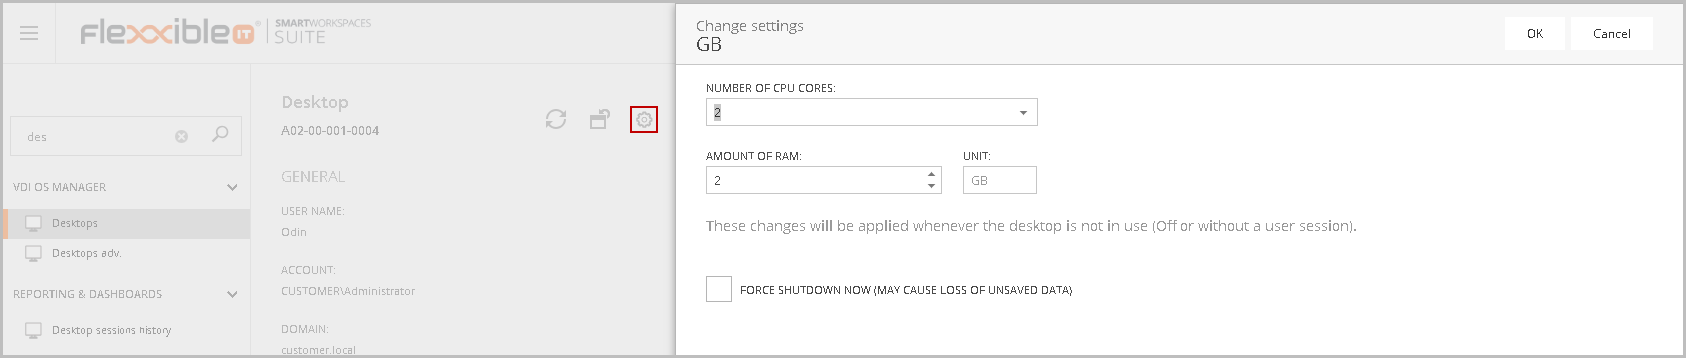
Considerations:
- This feature is only applicable in persistent desktops and requires restart the desktop.
- The professional desktops must be resize at the pool level because the desktop is not directly related with the user.
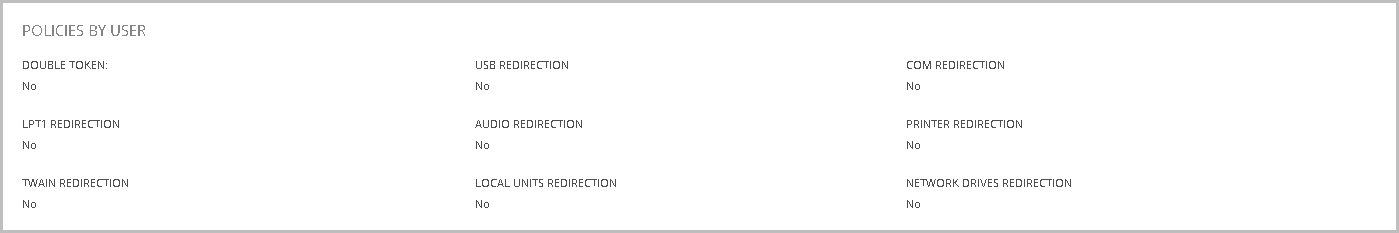
- Change user policies: The user policies entity is based in active directory groups. This allows manage the Citrix redirection policies that allows the interaction of peripherals and units between the VDI and the endpoint.
- Power and connection actions (as described in the previous section).
- Start remote assistance (as described in the previous section).
- Execute operation (as described in the previous section).
- Execute custom operation (as described in the previous section).
- Notify user (as described in the previous section).
- Update the VDI Client settings: these settings can be customized for each desktop.
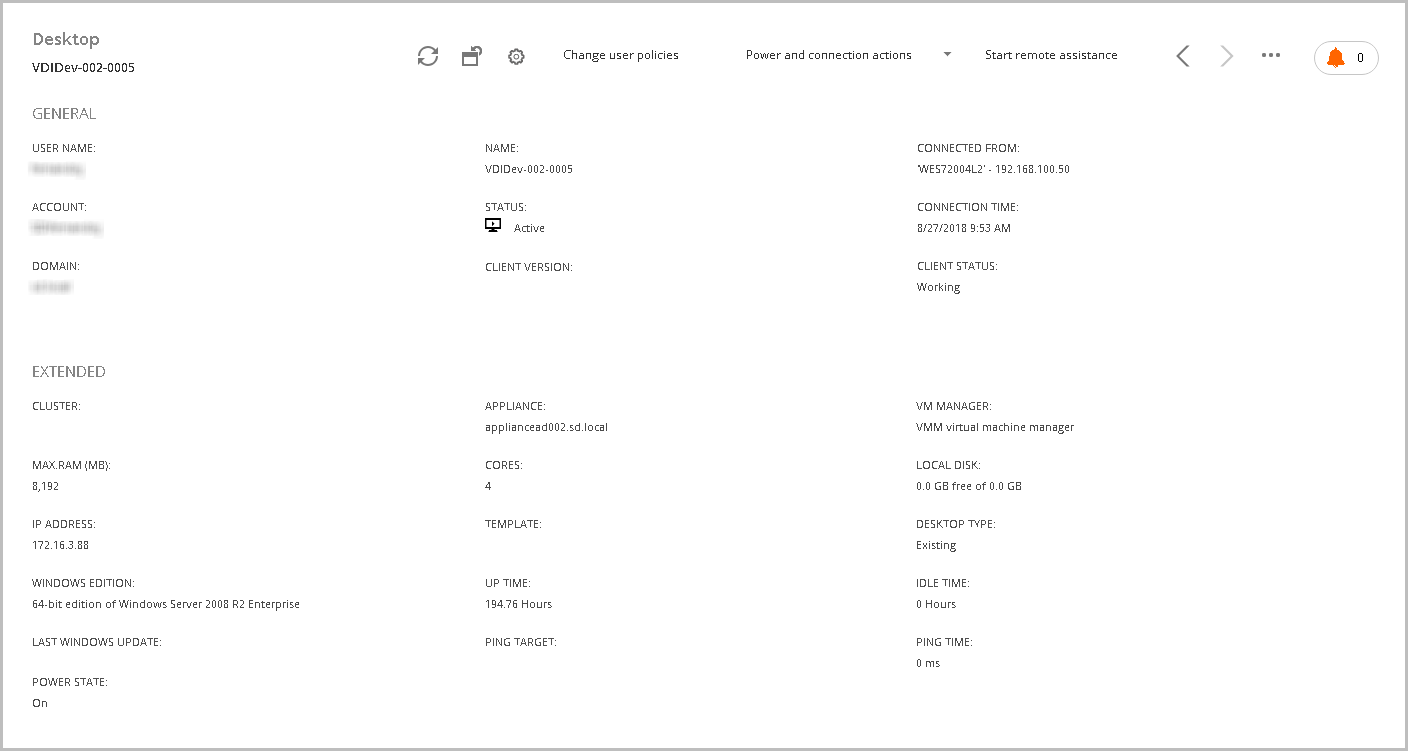
You can see a preview of the screen of the selected desktop from version 4.0.5 or later. This feature is only available for Hyper-V.
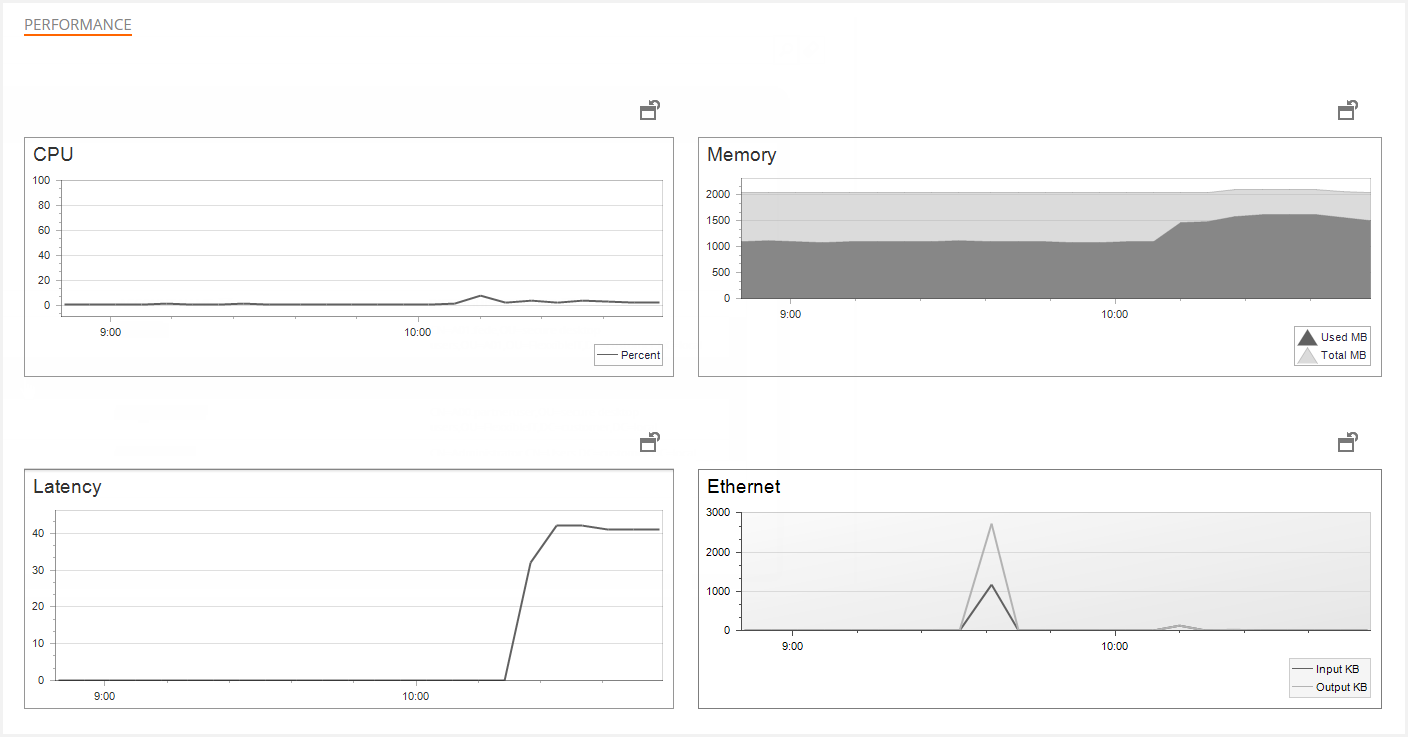
Performance
The performance graphs provide four fundamental data in the diagnosis of problems:
- CPU use: Very useful to identify defects in the sizing of a desktop.
- Memory use: Same as before.
- Latency: The latency is one of the most important aspects in terms of performance and user experience on a desktop. If the latency is above 150 ms, the user experience begins to suffer, after 200 ms it is directly inaccessible for the user.
- Ethernet: The network traffic is a very useful graph to detect anomalous behaviour in a desktop.
Tabs area in the desktop view
In the bottom of the page you can see a tabs area. In this lower section, a whole set of status, monitoring and configuration information is shown, so lots of additional actions can be performed and more detailed monitoring and support information is provided to the help desk engineer.
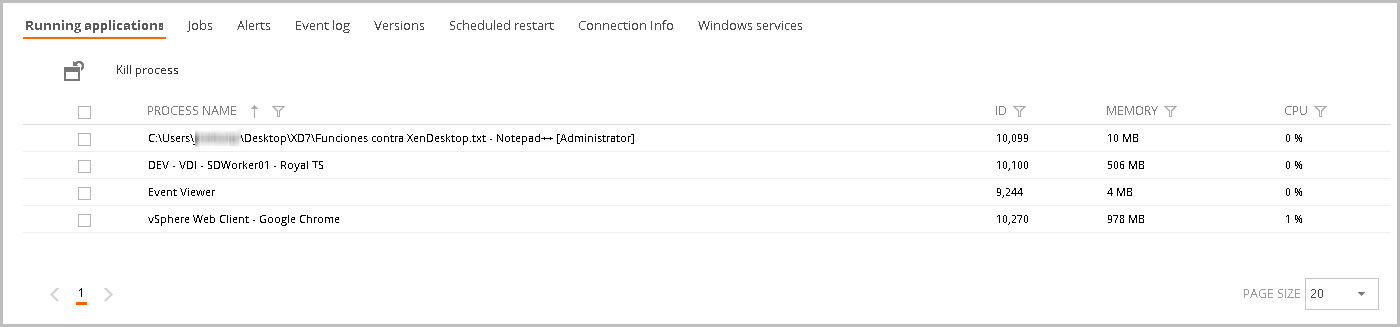
Running applications tab
The Running applications tab works as the Windows task manager remotely. This allows you to see the use of resources by applications that are running on the desktop and kill the selected processes.
- Process Name: Name of the running process.
- ID: PID of the service.
- Memory: Memory usage.
- CPU: Percent of used CPU.
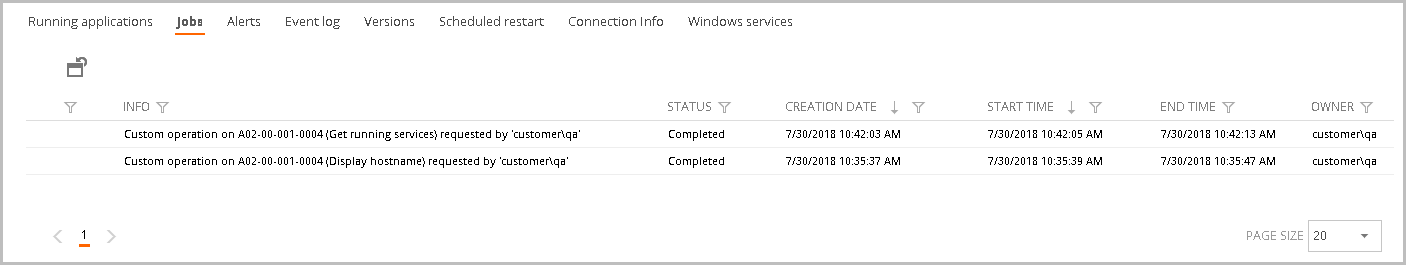
Jobs tab
The Jobs tab shows all the jobs performed on the server. This view displays the following information:
- Name: Job name.
- Status: Job status (pending, in process, completed, error, user cancelled or timeout).
- Creation date: Job creation date.
- Start time
- End time
- Owner: The job creation user.
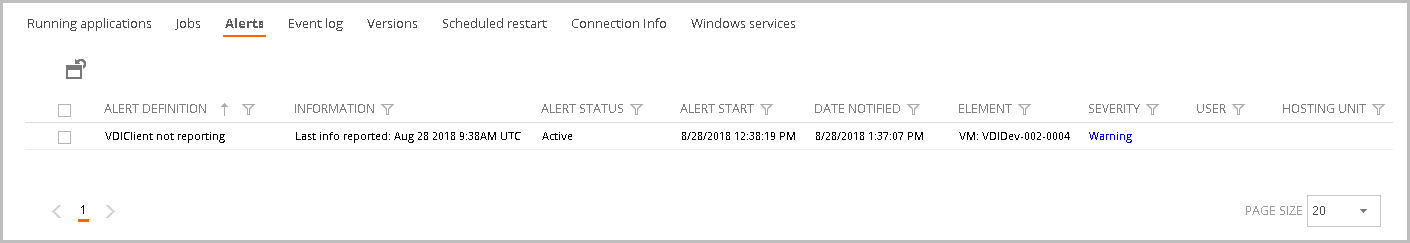
Alerts tab
The Alerts tab shows the subscribed alerts when the threshold defined in the parameter to be monitored is reached.
- Alert definition: The alert name.
- Information: The alert detail.
- Alert Status: The alert status. Can be active or incative.
- Alert Start: The alert start time.
- Date Notified: The alert notification date.
- Element: The affected server.
- Severity: Level of alert severity. Can be warning, error or critical.
- User: The user that generates the alert (if applies).
- Hosting Unit: The hosting unit related (if applies).
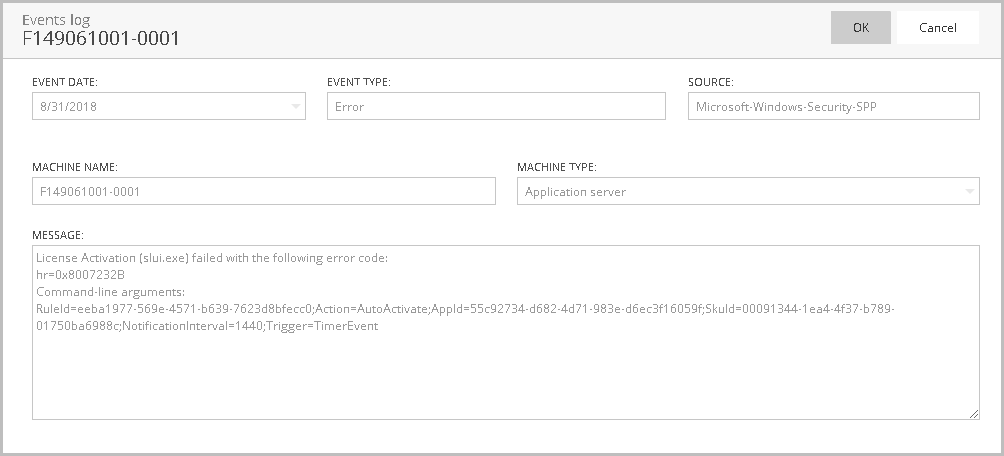
Event Log tab
The Event log tab collects the error events from desktops and infrastructure servers. Clicking you can see more detailed the event log in a modal window.
- Date: The date the event occurred.
- Type: Type of event (Information, Warning, Error, Success Audit and Failure Audit)
- Source: The source which generated the event. It could be an application or system component
- Message: The event description.
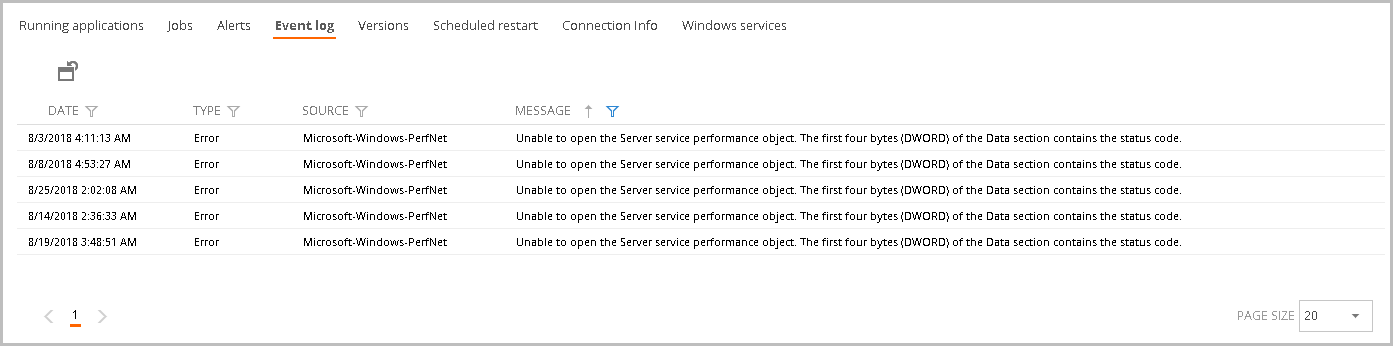
By clicking on the desired item, a modal window with more information about the selected event record is displayed.
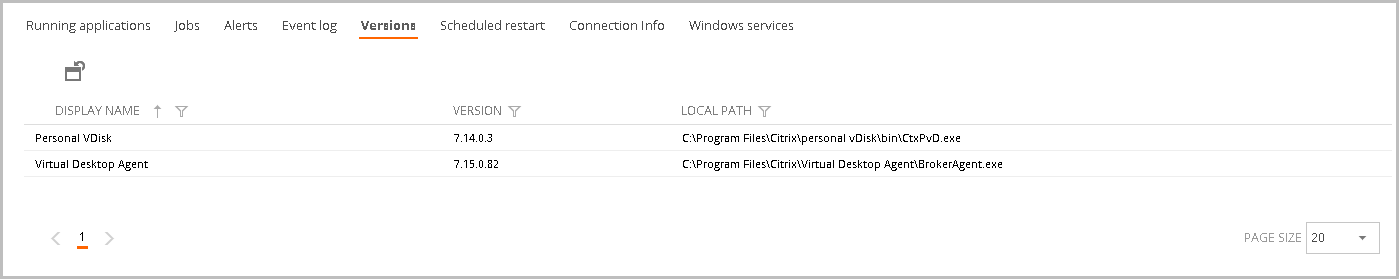
Versions tab
The Versions tab shows all the Versions of the installed Citrix Services.
- Display name: Citrix Service Name.
- Version: Service version.
- Local Path: install path.
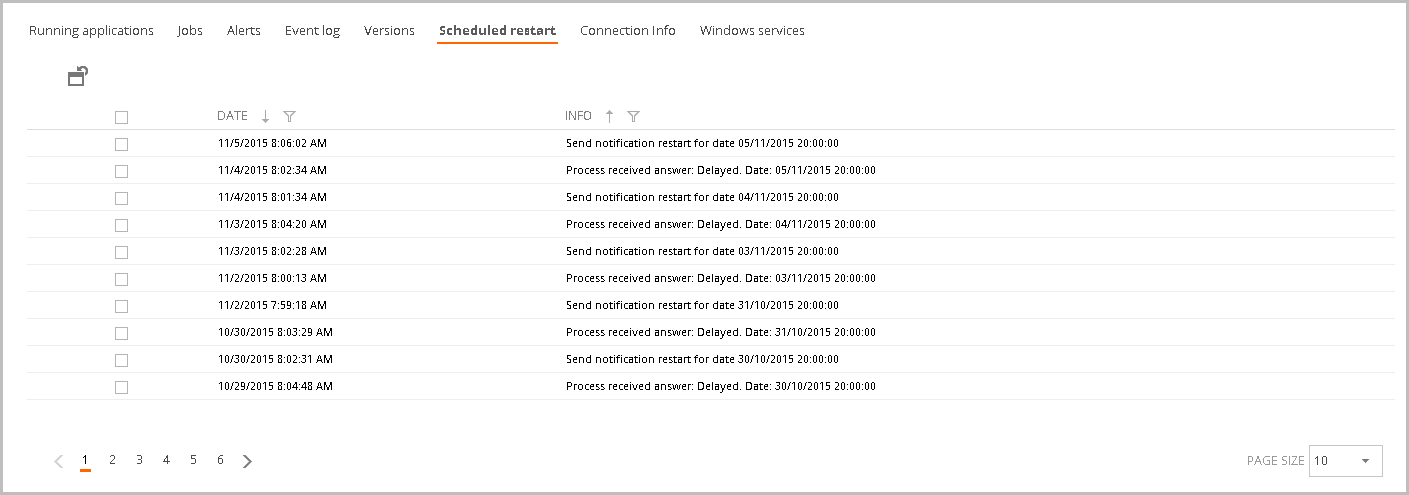
Scheduled restart tab
The Scheduled restart tab shows the list of scheduled restarts, their date and information about each one.
- Date: Date of schedule.
- Info: Scheduled process.
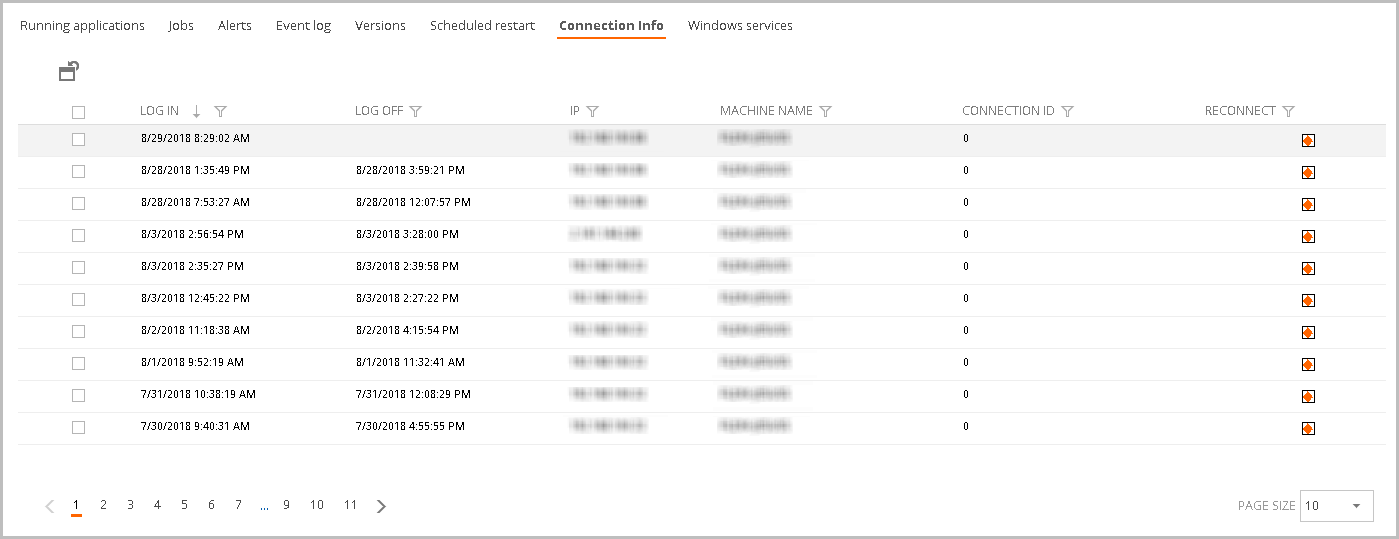
Connection info tab
The Connection Info tab we can see the following information:
- Log in: The log in date.
- Log off: The log off date.
- IP: The IP of the user who logged in.
- Machine name: The desktop name.
- Connection ID: The connection ID.
- Reconnect: This is checked if the user has been reconnected in this session.
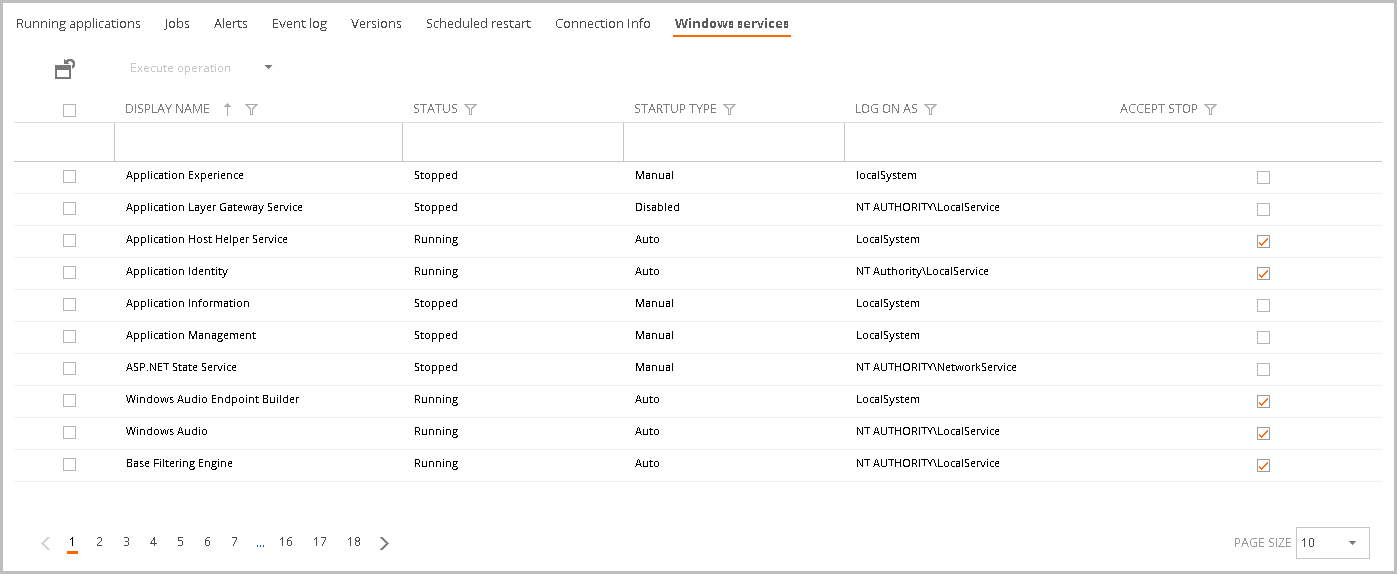
Windows services tab
The Windows Services Tab is a view of the system services. This allows to start, stop and restart services.
- Display Name:The windows service name.
- Status: The service status (stopped or running).
- Startup type: The service startup type (Manual, Disabled or Auto).
- Log on as: The service log on account.
- Accept stop: If the server allows to be manually stopped.