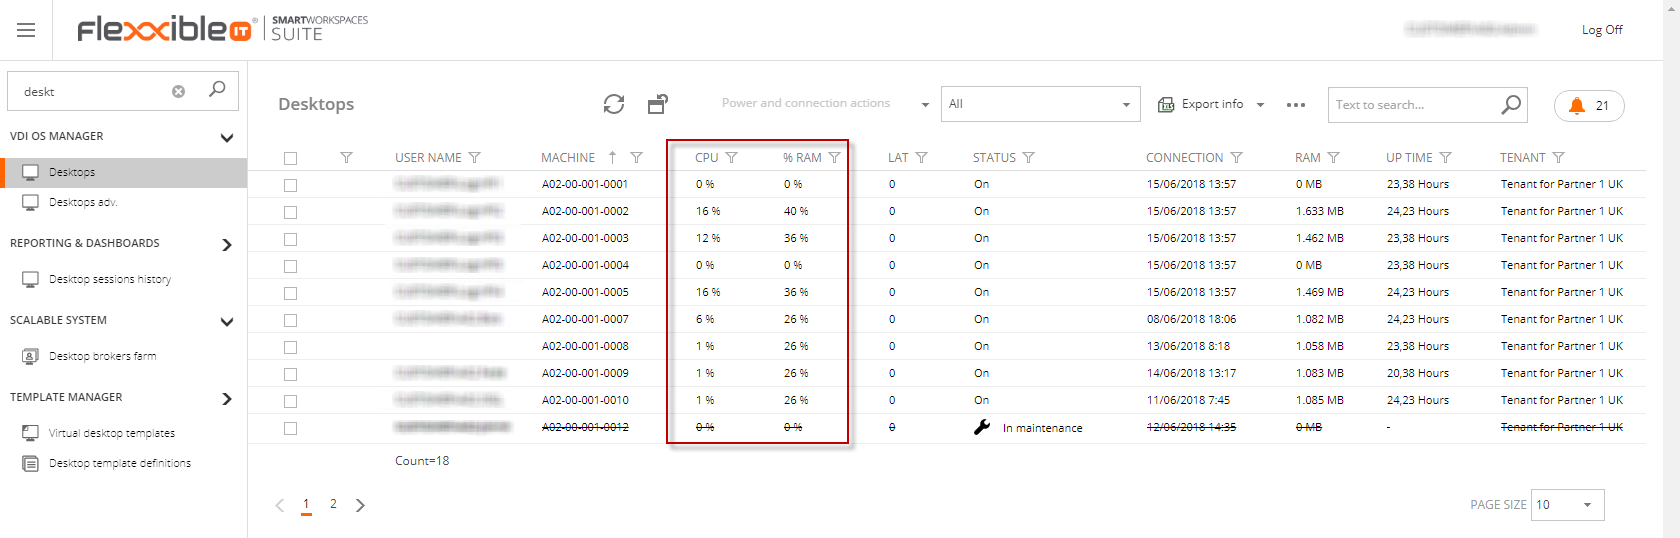
The capacity of Flexxible|desktops is managed through different mechanisms, the most essential one is that the use of resources, CPU and RAM usage can be easily checked in the Desktops section:
For further information, such as errors generated in the events logs viewer and in the alerts section regarding the desktops under analysis, you must access the extended details view for each desktop:
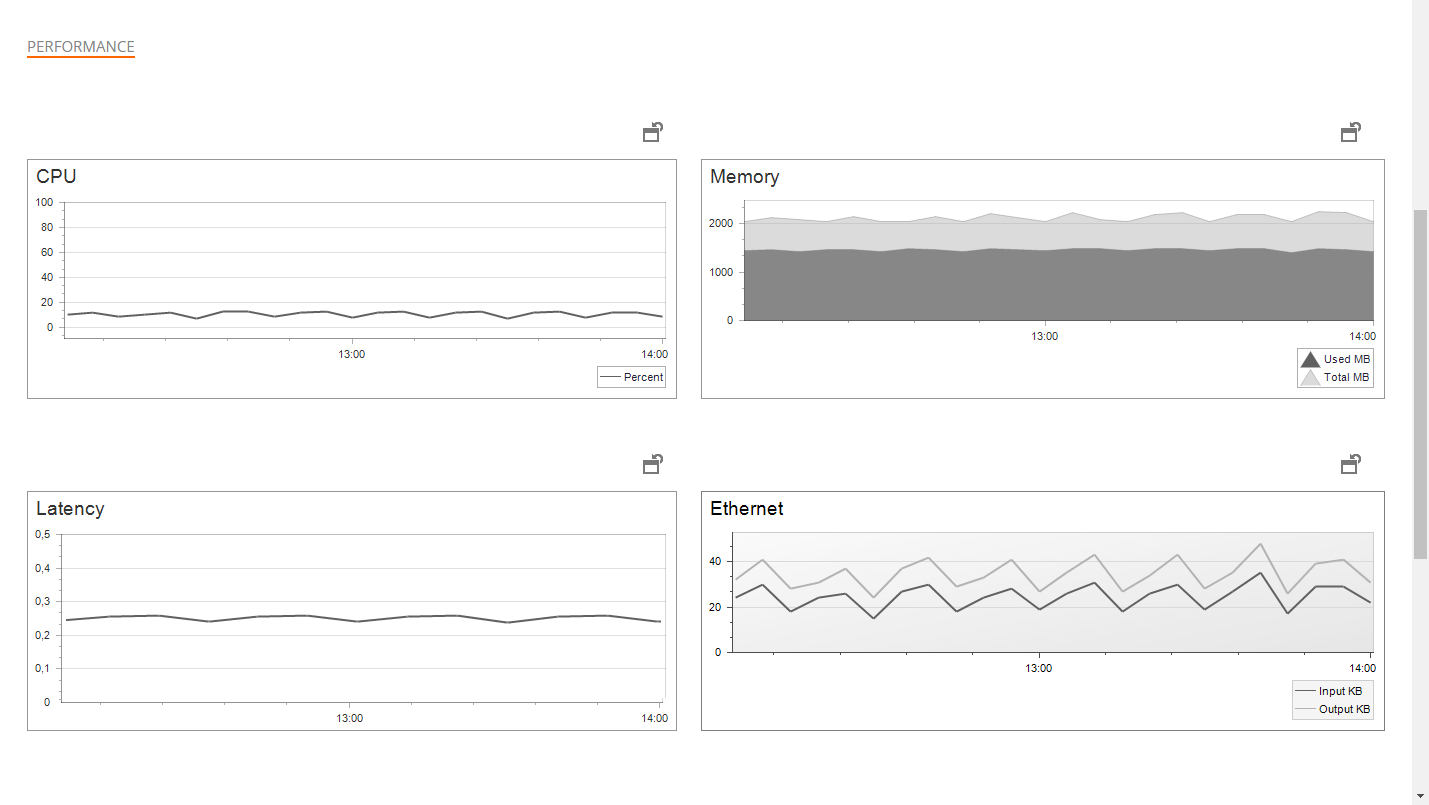
In the image above, you can see the usage of resources, as well as the latency in an active desktop session.
On the tab menu below you can obtain information regarding:
- Applications running.
- Desktop-related jobs.
- Active alerts.
- Events on the desktop's event log.
- Information on versions of the desktop's Citrix components.
- Information regarding auto-restart controllers.
- History of established connections.
- Redirected view of desktop windows services.
- Applications installed via Flexxible|VDI Client.
Specific alerts on desktop capacity
In the Alert Definition section, there are several alerts available related to the capacity of desktops, such as:
- High CPU usage - Desktop.
- High desktop application CPU usage.
- High latency.
- High RAM usage - Desktop.
- Multiple errors in event log.
- Storage alert for Desktop less than 2GB.
- User inactive for a long time.
- VDIClient not reporting.
- VM assigned RAM under minimum.
- VM in maintenance mode.
- VM name mismatch.
- VM status mismatch.
To subscribe to these alerts, you just have to link the alert definition to the notification profile, and from then onwards, the subscription is generated for future alerts.
Flexxible|SUITE - User Experience Issues Diagnose
When a particular user is experiencing a poor performance(i.e.. slow response, frozen desktop, etc) a diagnose should be applied to alleviate the situation. Apart from verifing that the client LAN, the communication layers, and the endpoints are working fine, Flexxible|VDI OS Manager provides enough information about the user's desktop to help us speed up the diagnose process.
Performance Diagnose
In the Desktop view you can find very useful information that will help you improve the process of diagnosing your VM, such as:
- CPU utilization:
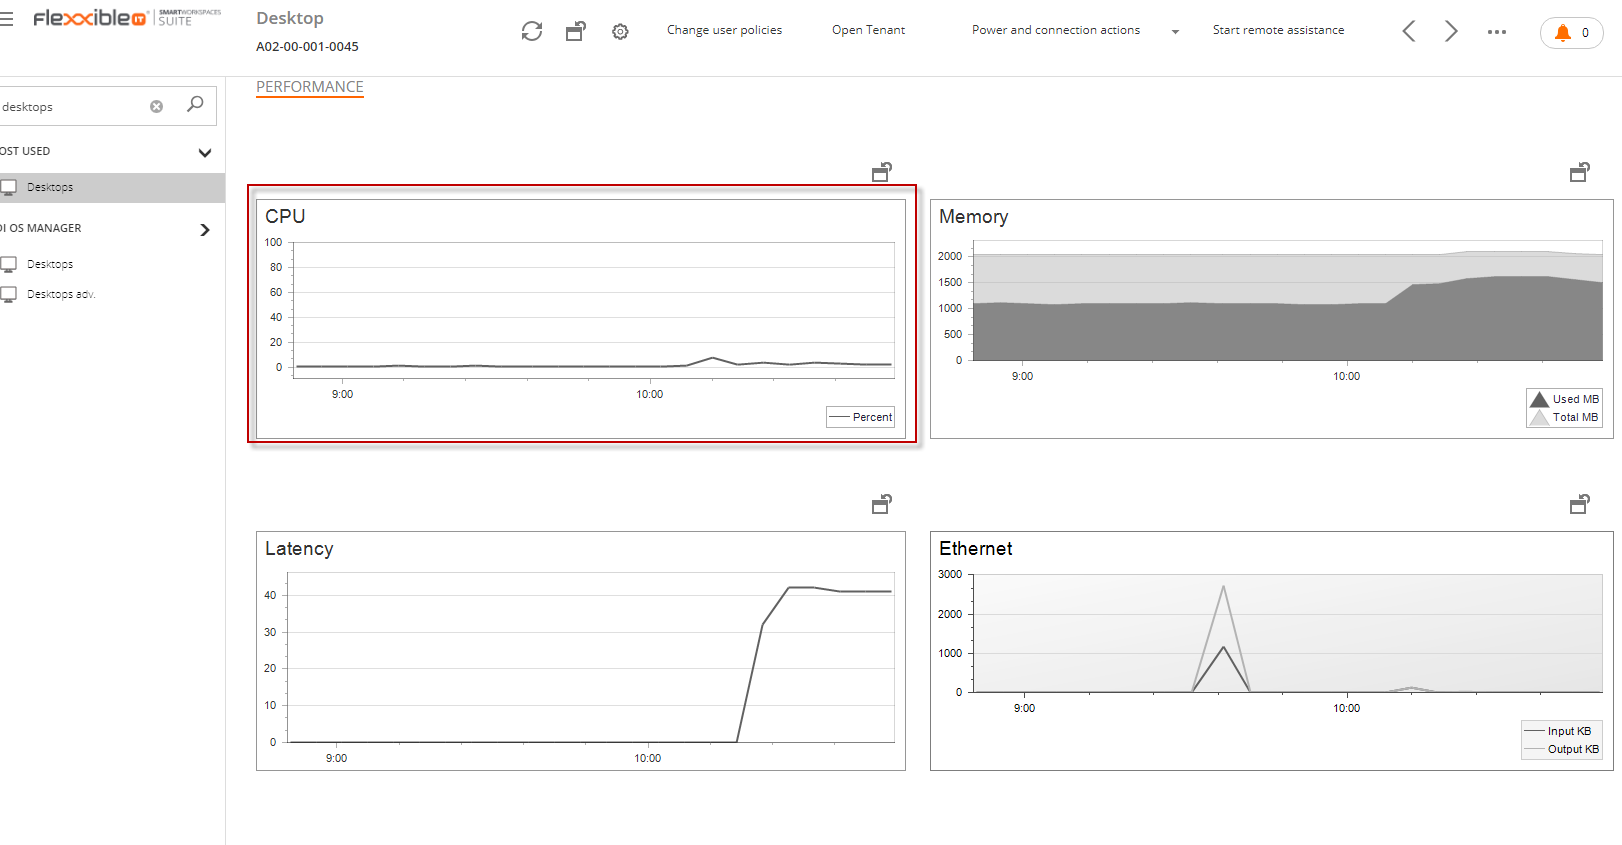
- Network Connectivity:
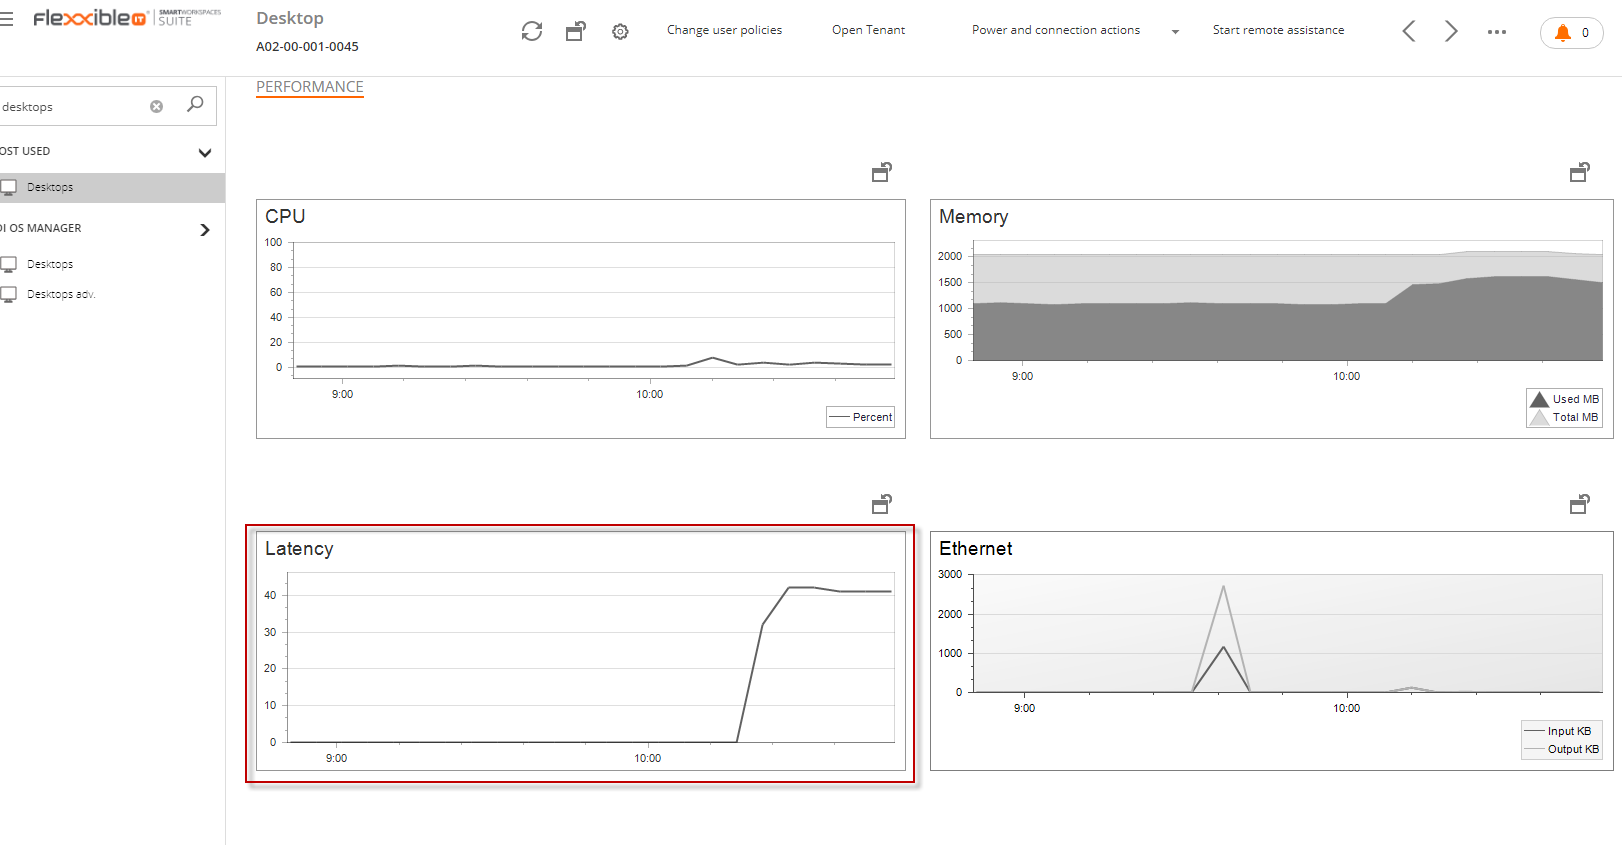
In the above charts we can see the Latency on the user's LAN, communication layers and the end points. If the latency reaches the 200 miliseconds threshold, the user experience starts getting worst. Initially the user may not notice it. But after the latency continues increasing, the user may start experiencing annoying delay while typing, slow performance while moving the mouse and even getting a frozen desktop.
- Active Alerts:
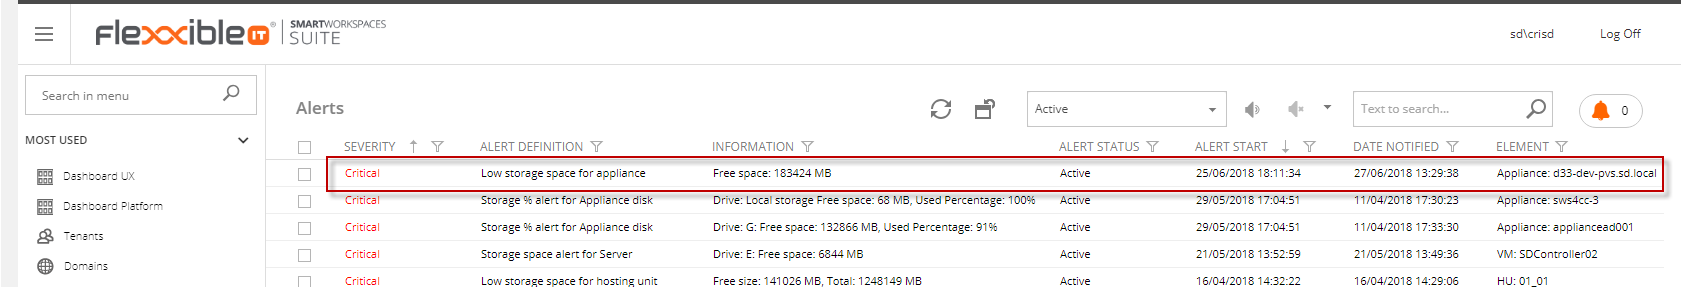
If the desktop reaches the Alert threshold set up for any of the configured alerts, such alert will be displayed in the "Alerts" tab in order to ease the diagnose process.
- Event Log:
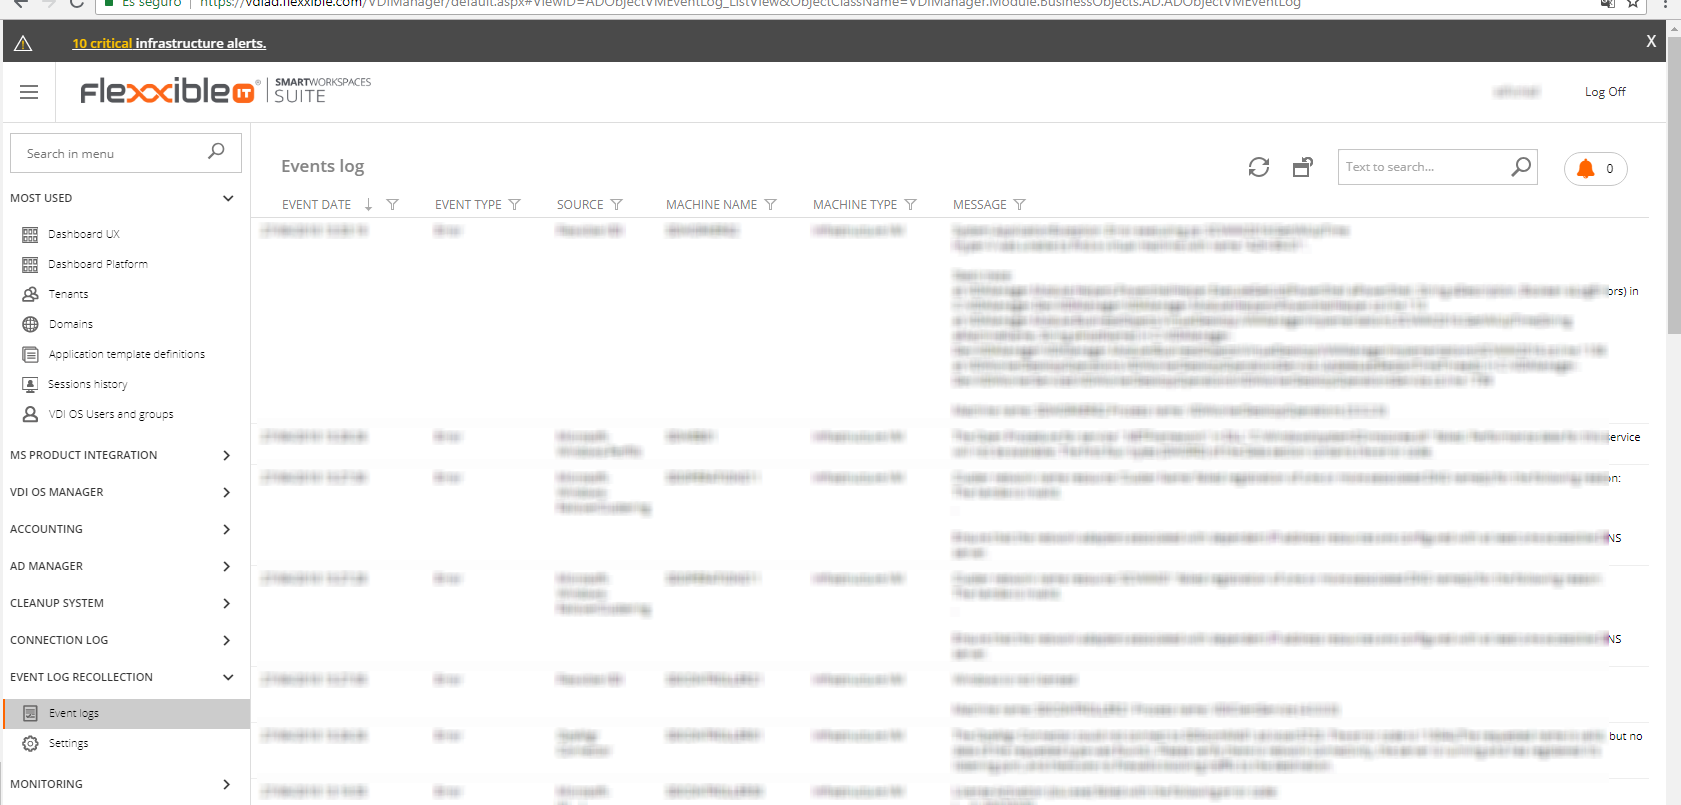
If the user is having a problem which generates an error message in the event log, such error message will be displayed in the "Event Log" tab view
Additional Tests
We can also test the desktop from a different network to determine if the problem is related to the desktop itself, or if the issue is related to the client's network
Please refer to the Flexxible|Help Desk Tool article for more information.