Alert
Overview
Flexxible|SUITE provides a customizable monitoring system, which fully covers the most important event types. This service also notifies the user about the raised alerts.
E.g. The system CPU occupation shouldn't exceed 80% for a longer period than the predefined one. If so, it's expected the monitoring system to raise an alert and send a notification by email or SMNP to the subscribed user(s).
This alert system is based on these three components:
- Subscription to alerts.
- Notification profiles.
- Alert definitions.
The user notification profile is subscribed to the selected alert definitions.
You may find these features in the Monitoring & Reporting area, on the left menu:
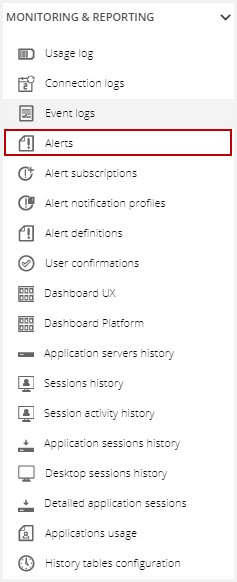
Alerts
The Alerts list is displayed in this interactive grid:
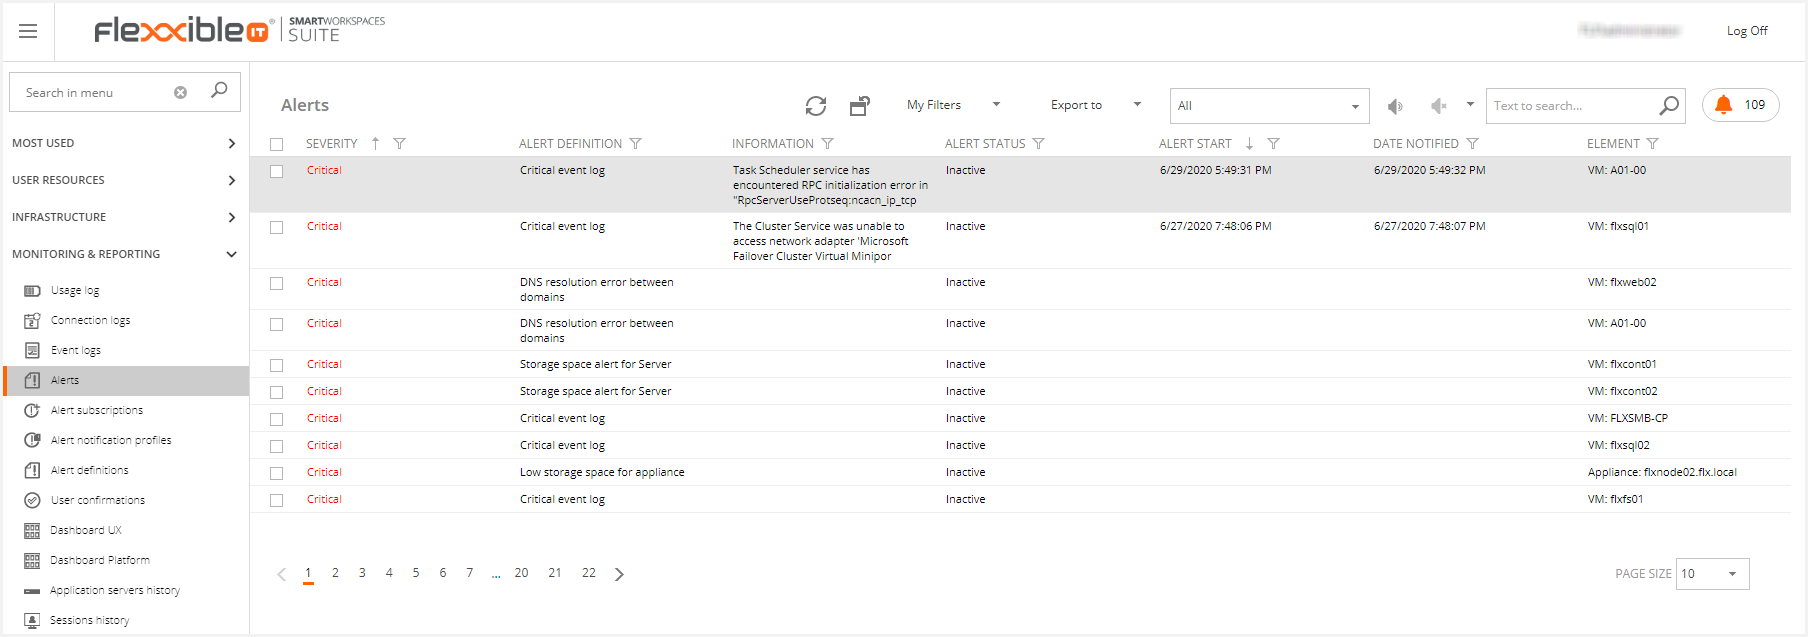
As capabilities, you can:
- Filter by status.
- Reactivate/Ignore an alert.
- Search for alerts by text.
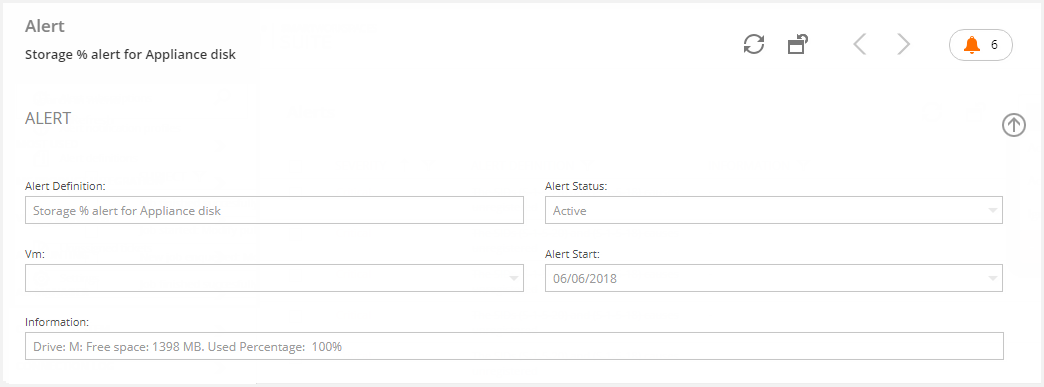
The alert detail contains the following information:
- Alert definition: The name of the defined alert.
- Alert Status: Active or Inactive.
- VM (if needed): The name of the desktop or server related to the alert.
- Alert start: The start date of the alert.
- Information: To improve diagnosis processes, additional information has been added to alerts showing the condition which activated them.
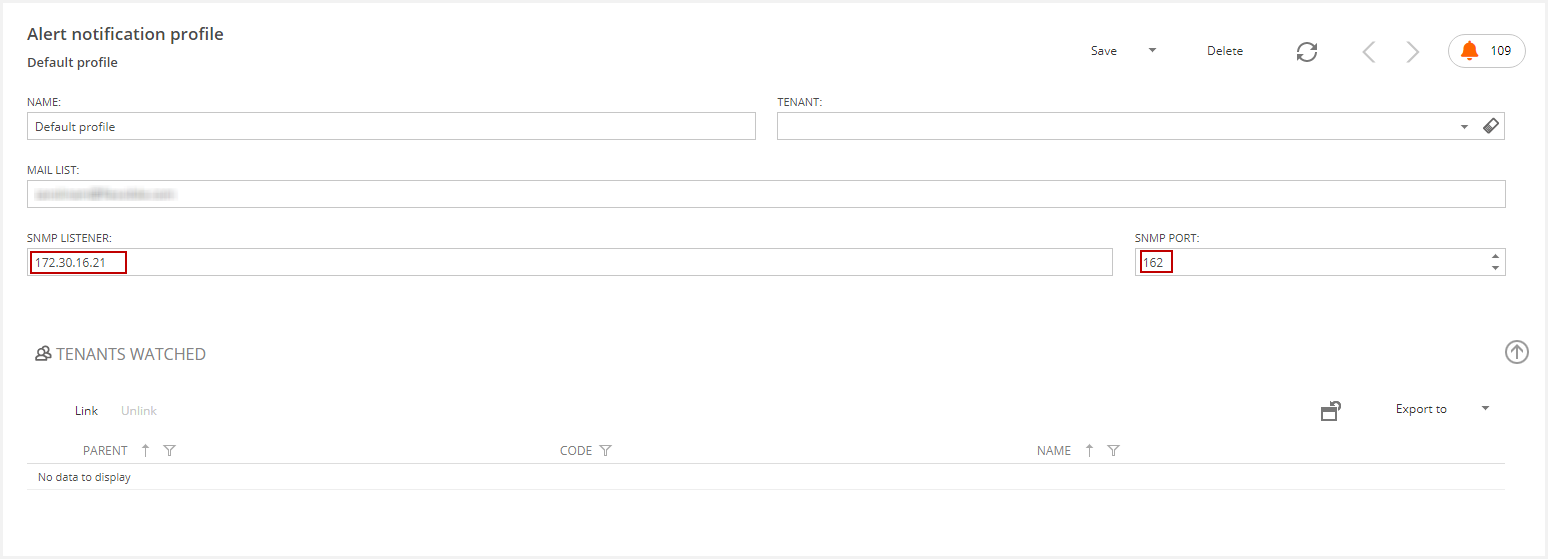
Alert Notification Profiles
This feature allows a user to set up a notification profile. This is an entity needed to notify a user about the alerts he's subscribed to.
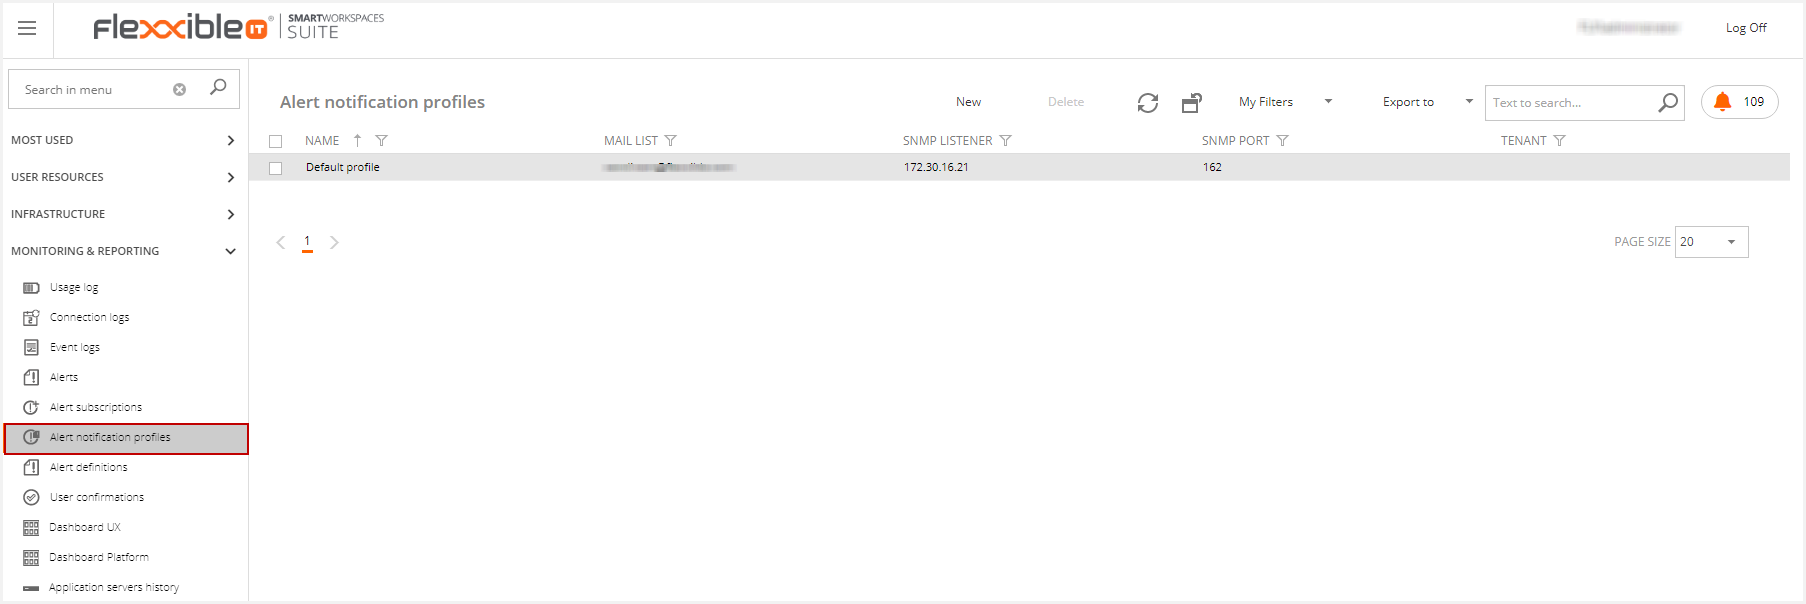
- Profiles list. It shows those in "active" status.
- Add a new profile.
- Delete an active profile.
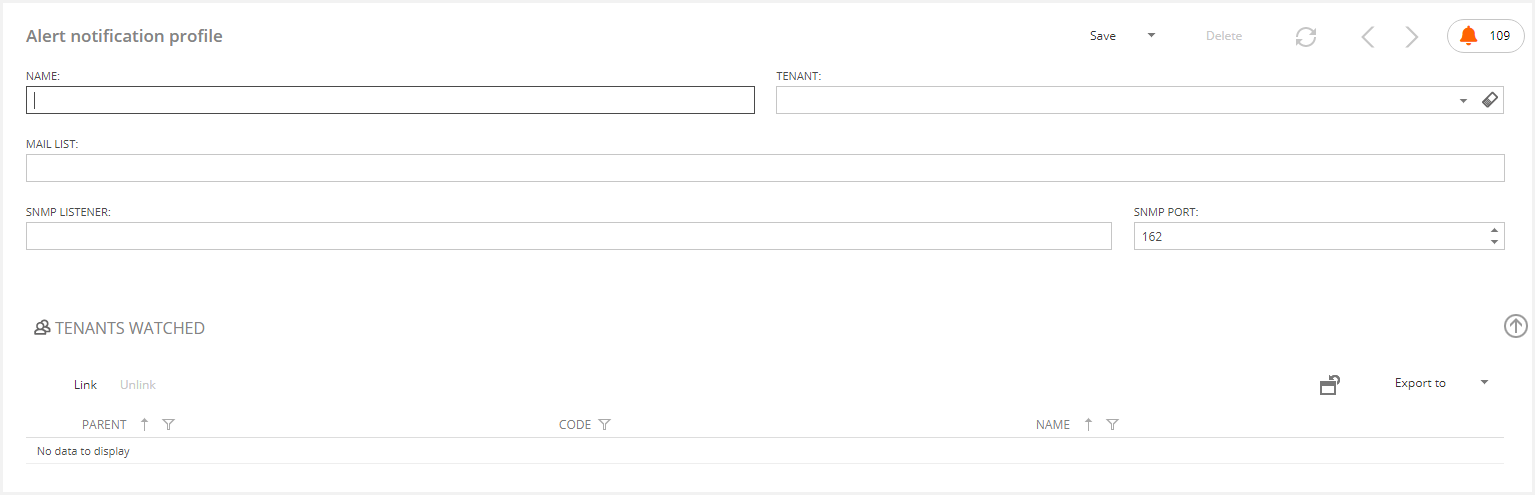
To add a new profile you should:
- Click on the "New" button, so the New Profile form is displayed.
- Fill the name.
- Save the new profile data.
Optionally you can specify a tenant, a mail list, a notification SNMP listener, or an SMS list.
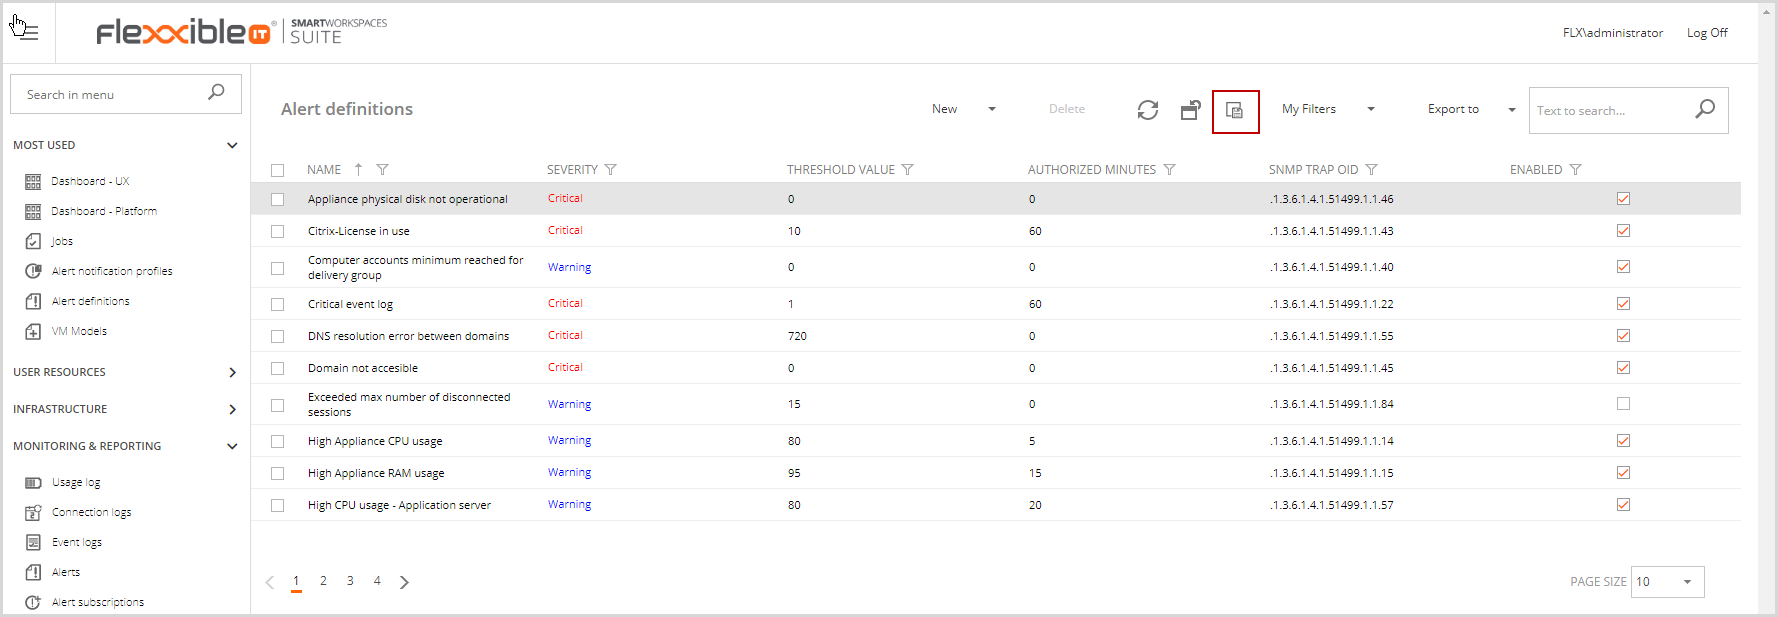
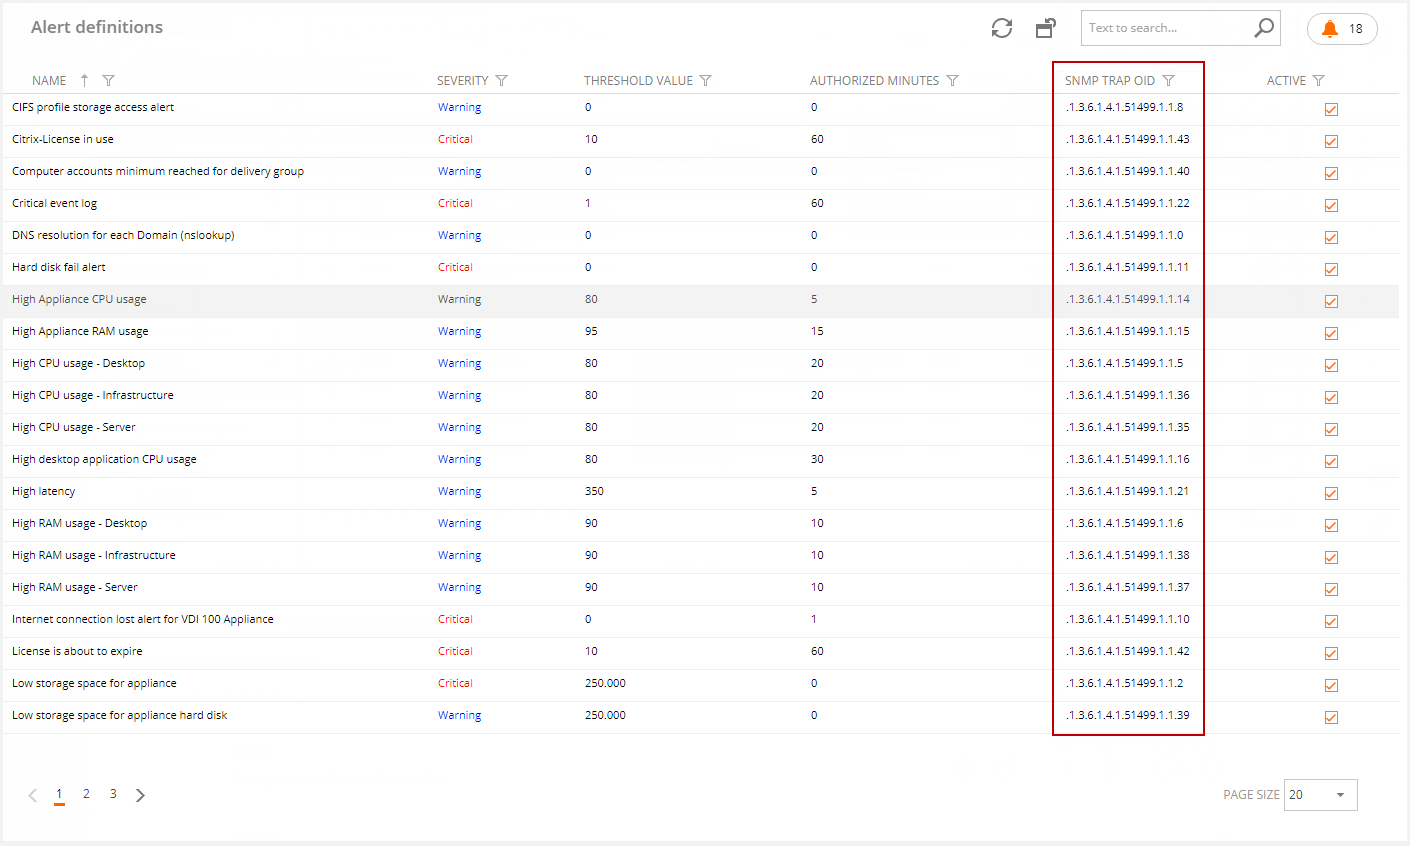
Alert Definitions
If a known event type meets a monitored alarm criterion (either a set of conditions or just a single one) for a specified time, the system will detect it and raise the related alert.
This is the alert raising conditions setup area:
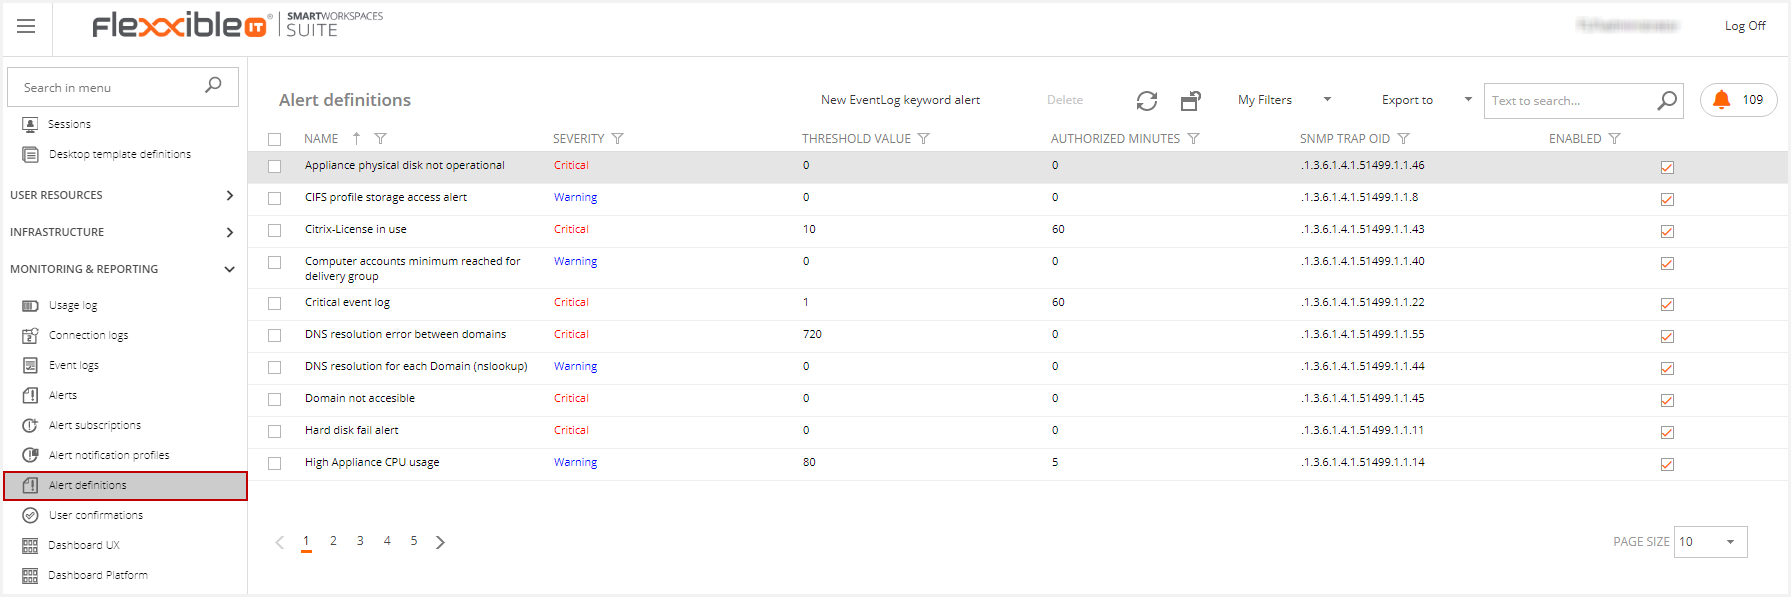
The current system monitoring alarms for any alert type are:
- Severity: it's the type of alert. It also references the impact of an event on the system.
- Threshold Value: it's the boundary the system can tolerate without compromising any related service.
- Authorized minutes: it's the maximum allowed time that an event may happen before a system alert is raised.
The stored threshold value can be edited in the Alert Definition area to adapt the monitoring system to the environment's needs.
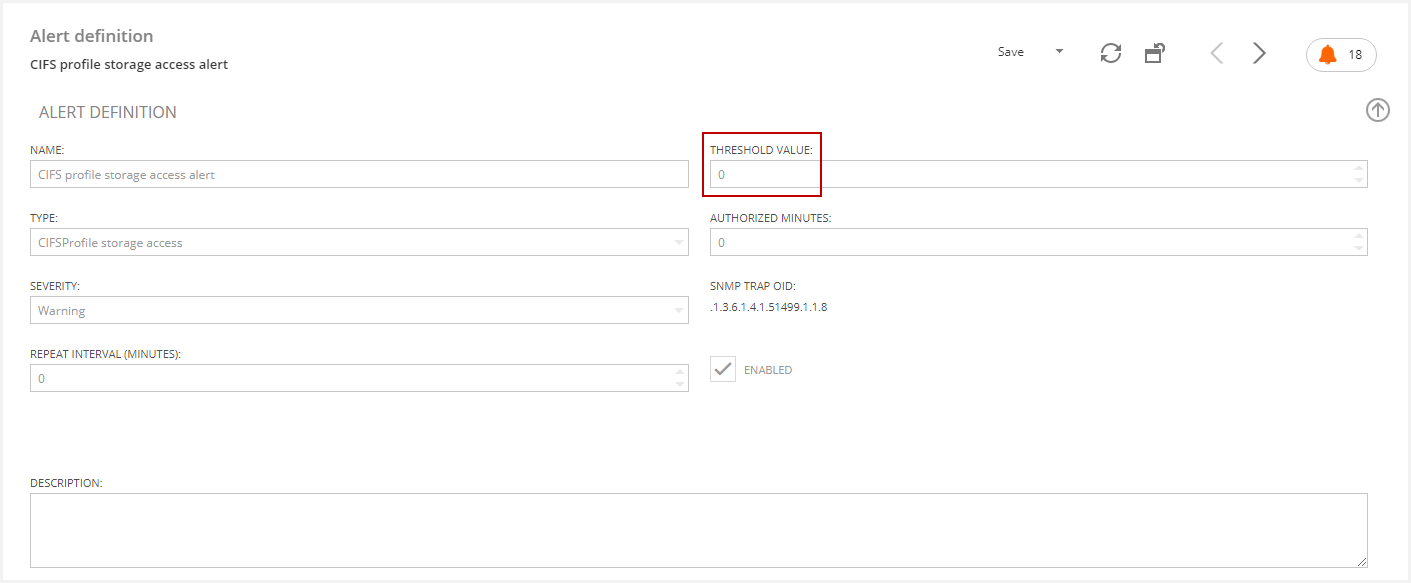
From version 4.10 onwards, it will be possible to download the SNMP .MIB definition file.
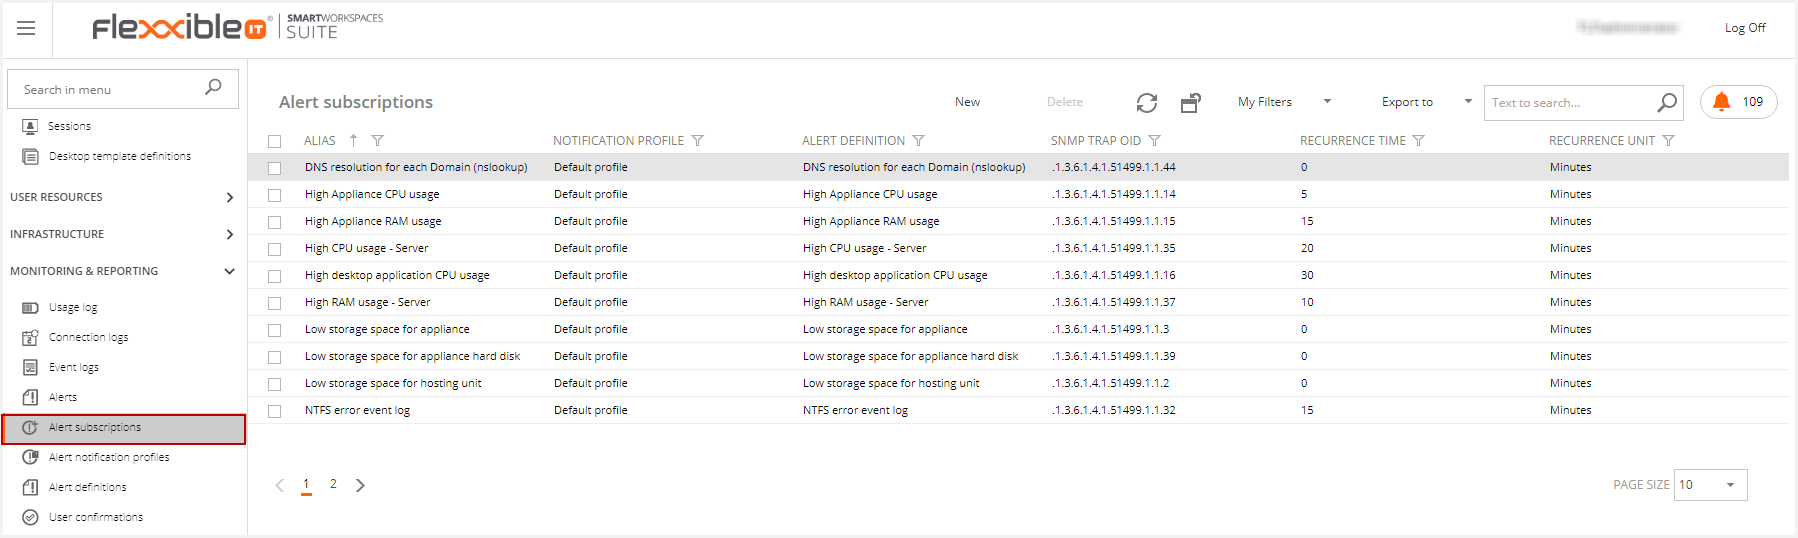
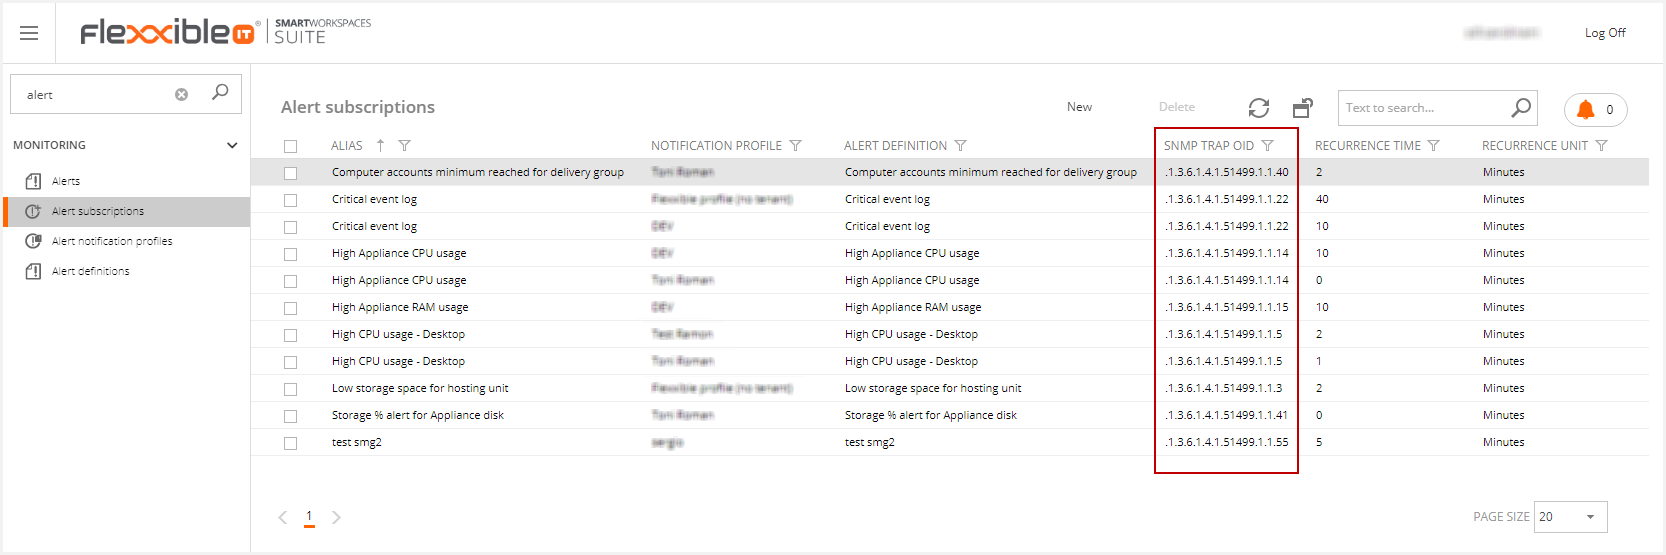
Alert Subscriptions
This feature allows a user to sign up for those alerts he needs to be notified about.
The active subscriptions are displayed in the Alert subscriptions list:
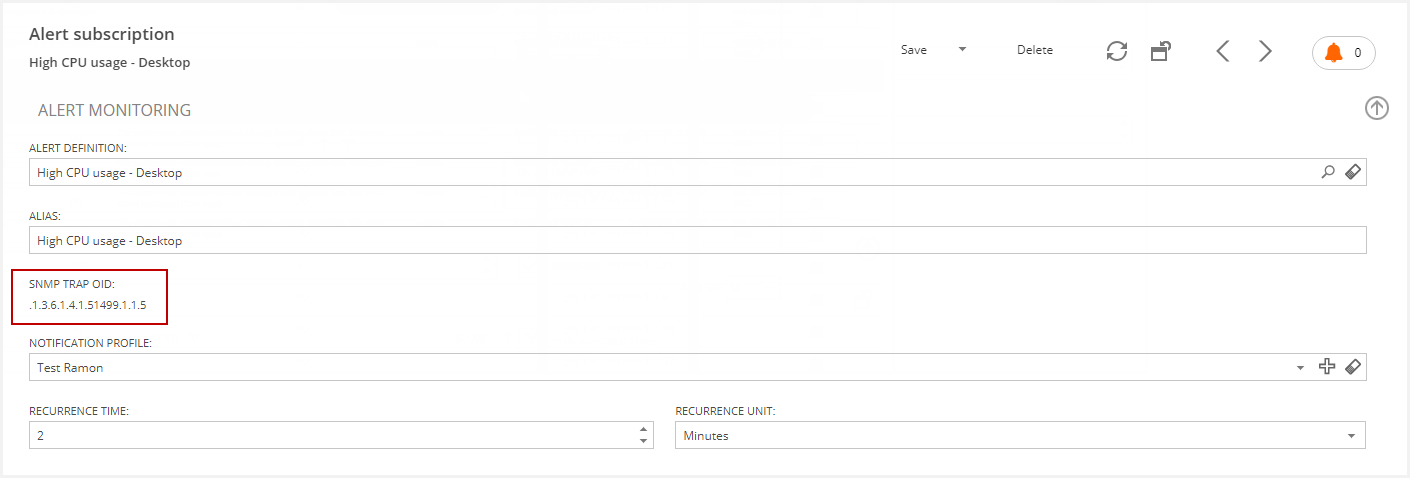
You may add a new subscription profile by clicking on the "New" button. Then, the "Alert definition" form should be displayed:
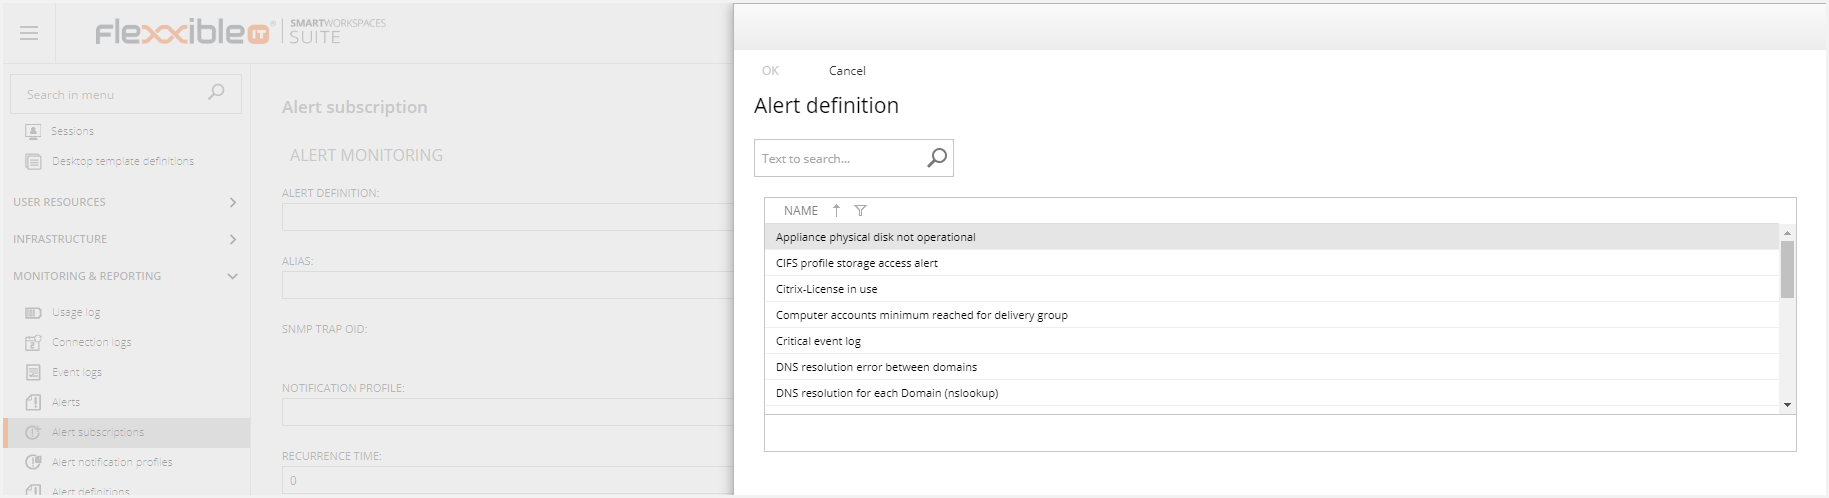
Then:
- Click on the search of the Alert definition field.
- Use the search filter until the desired alert is found.
- Select the alert.
- Save changes by clicking on the "OK" button.
SNMP Notification
This feature allows a customer to be notified about the VDI OS Manager alerts via the SNMP v2 (Simple Network Management Protocol) and to handle them by his operation management tool (e.g. OpManager, Nagios, Zabbix, etc).
An allowed user can set up an SNMP server from his Alert notification profile area in VDI OS Manager to send an alert notification through a trap (SNMP message).
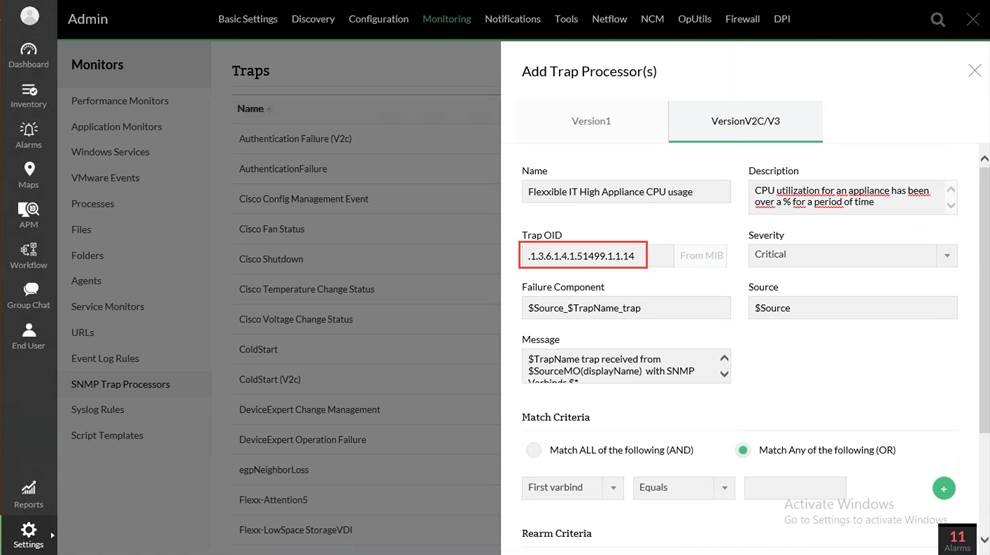
The monitoring tool administrators should be able to set up the related SNMP trap handling using the trap OID that can conveniently be found in several views for each alert type.
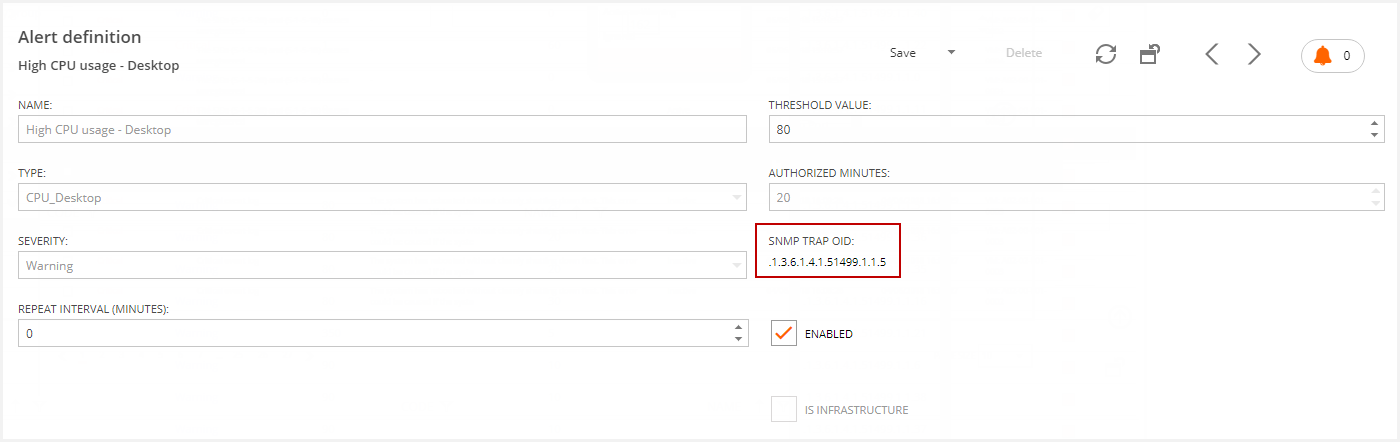
It's easy for an administrator to copy that trap OID and add the related alert to his monitoring system.
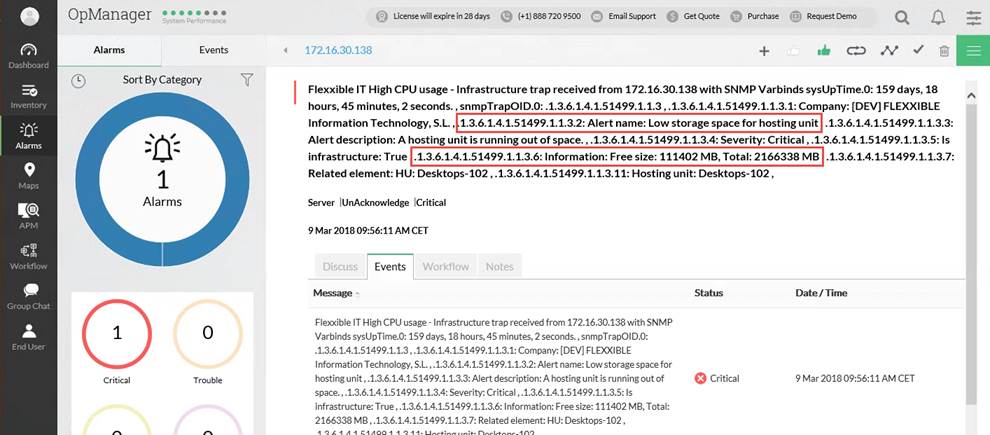
So, if the VDI System raises any alert, the monitoring tool will receive the related SNMP trap.
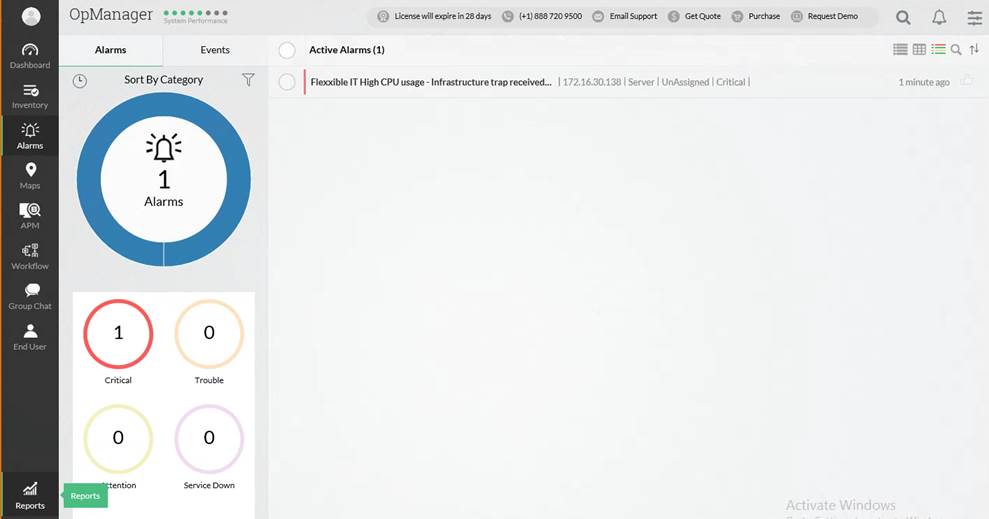
The SNMP Trap contains additional information about the alert, as an email notification does.
Please note that SNMP integration is only available with Flexxible|Suite Platinum or Flexxible|Suite Platinum Multitenant licensing.
Roles
Depending on the user role and tenant visibility, Flexxible|SUITE allows enabling the different alerts sections.
For each role, the alert view is enabled. If the user has no tenant assigned, the infrastructure alerts are visible too for this user.
The alert notification profile and subscription are enabled for all the users independently of their role.
The alert definition is only available for administrator and partner roles. If a partner defines an alert, the alert applies only to their tenant.
- Only the administrator and partner role user in this tenant can use the created alert definition.
Annex 1 - Alerts Definition
The customer must subscribe to every alert he wants to be notified about.
These are the default system alerts.
| NAME | DESCRIPTION | SEVERITY | THRESHOLD VALUE | AUTHORIZED MINUTES | SNMP TRAP OID |
| Appliance physical disk not operational | This alert warns whenever an appliance's physical disk status is not 'Ok' | Critical | 0 | 0 | .1.3.6.1.4.1.51499.1.1.46 |
| Citrix-License in use | This alert warns the available Citrix licenses | Critical | 10 | 60 | .1.3.6.1.4.1.51499.1.1.43 |
| Computer accounts minimum value reached for the delivery group | The number of available computer accounts for a delivery group reached the minimum value. | Warning | 0 | 0 | .1.3.6.1.4.1.51499.1.1.40 |
| Critical event log | A critical event was registered in a machine. | Critical | 1 | 60 | .1.3.6.1.4.1.51499.1.1.22 |
| DNS resolution error between domains | Indicates that an inter-domain DNS issue has been detected in the event log | Critical | 720 | 0 | .1.3.6.1.4.1.51499.1.1.55 |
| Domain not accessible | This alert warns if access to the domain fails | Critical | 0 | 0 | .1.3.6.1.4.1.51499.1.1.45 |
| Exceeded max number of disconnected sessions | The number of disconnected sessions in an application server is greater than the configured threshold | Warning | 15 | 0 | 1.3.6.1.4.1.51499.1.1.84 |
| High Appliance CPU usage | CPU utilization for an appliance has been over a % for some time | Warning | 80 | 5 | .1.3.6.1.4.1.51499.1.1.14 |
| High Appliance RAM usage | RAM allocation in an appliance has been allocated over a % for some time | Warning | 95 | 15 | .1.3.6.1.4.1.51499.1.1.15 |
| High CPU usage - Desktop | Alerts that the CPU utilization has been over a % for some time. | Warning | 80 | 20 | .1.3.6.1.4.1.51499.1.1.5 |
| High CPU usage - Application server | Alerts that the CPU utilization has been over a % for some time. | Warning | 80 | 20 | .1.3.6.1.4.1.51499.1.1.57 |
| High CPU usage - Infrastructure | Alerts that the CPU utilization has been over a % for some time. | Warning | 80 | 20 | .1.3.6.1.4.1.51499.1.1.36 |
| High CPU usage - Server | Alerts that the CPU utilization has been over a % for some time. | Warning | 80 | 20 | .1.3.6.1.4.1.51499.1.1.35 |
| High desktop application CPU usage | CPU utilization by an application on a desktop has been over a % for some time | Warning | 80 | 30 | .1.3.6.1.4.1.51499.1.1.16 |
| High latency | Alerts that the latency has been over some milliseconds for some time. | Warning | 350 | 5 | .1.3.6.1.4.1.51499.1.1.21 |
| High RAM usage - Desktop | Alerts that the RAM has been allocated over a % for some time. | Warning | 90 | 10 | .1.3.6.1.4.1.51499.1.1.6 |
| High RAM usage - Application server | Alerts that the RAM has been allocated over a % for some time. | Warning | 90 | 10 | .1.3.6.1.4.1.51499.1.1.58 |
| High RAM usage - Infrastructure | Alerts that the RAM has been allocated over a % for some time. | Warning | 90 | 10 | .1.3.6.1.4.1.51499.1.1.38 |
| High RAM usage - Server | Alerts that the RAM has been allocated over a % for some time. | Warning | 90 | 10 | .1.3.6.1.4.1.51499.1.1.37 |
| License is about to expire | Checks if the Citrix license is about to expire | Critical | 10 | 60 | .1.3.6.1.4.1.51499.1.1.42 |
| Low storage space for appliance | An appliance is running out of storage space. | Critical | 250.000 | 0 | .1.3.6.1.4.1.51499.1.1.2 |
| Low storage space for appliance hard disk | The free storage in a hard disk of the appliance is lower than recommended( MB) | Warning | 250.000 | 0 | .1.3.6.1.4.1.51499.1.1.39 |
| Low storage space for hosting unit | A hosting unit is running out of space. | Critical | 300.000 | 0 | .1.3.6.1.4.1.51499.1.1.3 |
| Low storage space for VCC Role | The free storage space for a VCC role drive is below the threshold value (MB). | Critical | 10.000 | 0 | .1.3.6.1.4.1.51499.1.1.20 |
| Multiple errors in the event log | Many errors have been reported in the last minutes. | Warning | 50 | 60 | .1.3.6.1.4.1.51499.1.1.23 |
| NTFS error event log | Event log error: The file system structure on the disk is corrupt and unusable. | Warning | 0 | 15 | .1.3.6.1.4.1.51499.1.1.32 |
| Num of professional users and desktops mismatch | The template has non-persistent more assigned users than desktops. | Warning | 0 | 60 | .1.3.6.1.4.1.51499.1.1.33 |
| Storage % alert for Appliance disk | The used storage % in an appliance disk is higher than recommended | Critical | 90 | 0 | .1.3.6.1.4.1.51499.1.1.41 |
| Storage % alert for non-infrastructure Server | The free storage in a server is lower than recommended (MB) | Warning | 80 | 0 | .1.3.6.1.4.1.51499.1.1.27 |
| Storage % alert for VCC Role | The used storage % in a VCC Role drive is over the threshold value. | Critical | 80 | 0 | .1.3.6.1.4.1.51499.1.1.19 |
| Storage alert for Application Server | This alert warns when the available storage space for an application server falls under the threshold size. | Warning | 2000 | 0 | .1.3.6.1.4.1.51499.1.1.56 |
| Storage alert for Desktop | This alert warns when the available storage space for a desktop falls under the threshold size. | Warning | 2000 | 0 | .1.3.6.1.4.1.51499.1.1.1 |
| Storage space alert for non-infrastructure Server | The free storage in a server is lower than recommended (MB) | Warning | 10.000 | 0 | .1.3.6.1.4.1.51499.1.1.28 |
| Unhealthy broker farm connection to VM Manager | This alert warns whenever a connection between a broker farm and a VM Manager is not fully functional. | Critical | 0 | 0 | .1.3.6.1.4.1.51499.1.1.85 |
| User inactive for a long time | The user has not connected to his/her desktop for some time. | Informational | 0 | 129.600 | .1.3.6.1.4.1.51499.1.1.29 |
| VDIClient not reporting | The VDIClient service in a secure|destkop or secure|server has not reported information for some time. | Warning | 0 | 120 | .1.3.6.1.4.1.51499.1.1.25 |
| VM assigned RAM under the minimum | The max amount of RAM (MB) assigned to a virtual machine is still under a minimum after some time. | Warning | 1.024 | 120 | .1.3.6.1.4.1.51499.1.1.24 |
| VM in maintenance mode | The secure|destkop has entered maintenance mode due to an unknown reason | Warning | 0 | 5 | .1.3.6.1.4.1.51499.1.1.26 |
| VM name mismatch | The internal name of the VM is different from the Hyper-V name | Informational | 0 | 0 | .1.3.6.1.4.1.51499.1.1.30 |
| VM status mismatch | The Virtual Machine Manager status of this VM is different from the Hyper-V status | Warning | 0 | 15 | .1.3.6.1.4.1.51499.1.1.31 |
Besides, it is recommended that the customer subscribes himself to the following alerts at least, to get basic monitoring of his infrastructure.
| ALIAS | ALERT DEFINITION | RECURRENCE TIME |
| Critical Event Log | A critical event was registered in a machine. | 60 Minutes |
| High Appliance CPU usage | CPU utilization for an appliance exceeded a specified % for some time | 80 Minutes |
| High Appliance RAM usage | RAM allocation in an appliance exceeded a specified % for some time | 95 Minutes |
| High CPU usage - Infrastructure | Alerts that the CPU utilization exceeded a specified % for some time. | 80 Minutes |
| High RAM usage - Infrastructure | Alerts that the allocated RAM exceeded a specified % for some time. | 90 Minutes |
| High CPU usage - Application server | It alerts of a sustained high CPU usage for an application server | 80 Minutes |
| High RAM usage - Application server | It alerts of sustained high RAM usage for an application server | 90 Minutes |
| Storage alert for Application server less than 2 GB | Alerts that available storage for an application server is low | 30 Minutes |
| Low storage space for appliance | An appliance is running out of storage space. | 30 Minutes |
| Low storage space for hosting unit | A hosting unit is running out of space. | 30 Minutes |
| Multiple errors in the event log | Many errors have been reported in the last minutes. | 60 Minutes |
Event log triggered alert
From Flexxible|SUITE version 4.0.3 onwards, a new feature has been added to allow the creation of new alerts based on Windows event logs which may be raised on any virtual machine or host being monitored in the environment.
Please refer to the Event log triggered alert article.
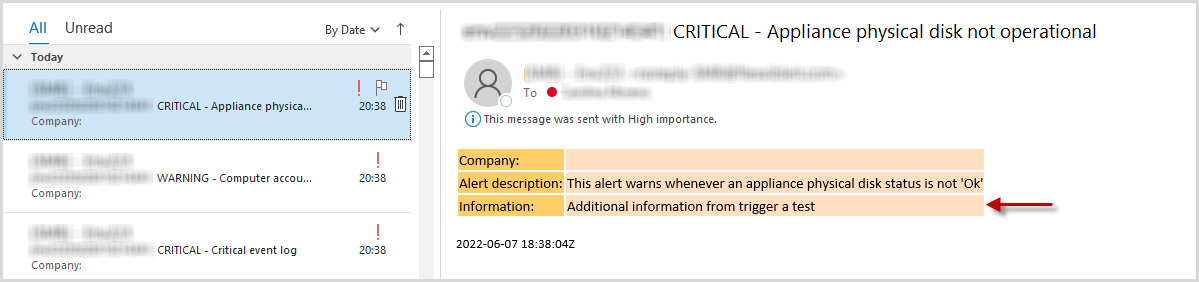
Trigger a test
From version 4.13.0.0 onwards, Flexxible|SUITE provides the "trigger a test" feature. This feature allows sending fake notifications of the selected alerts for testing purposes.
This is available in the alert definitions and the health checker configuration.
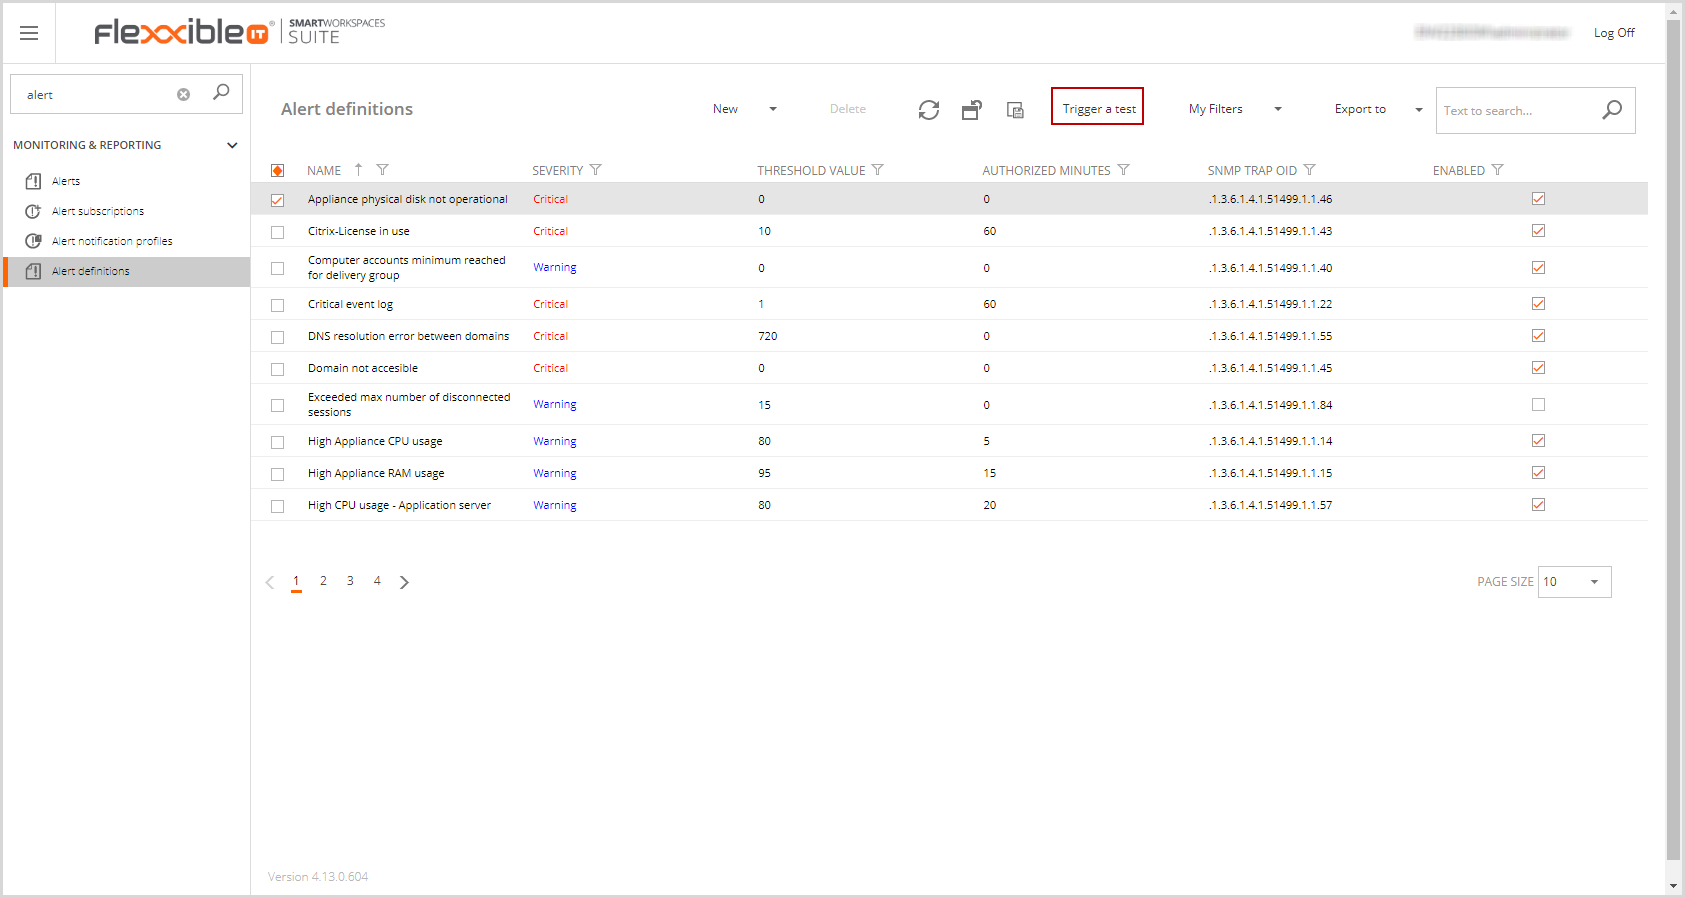
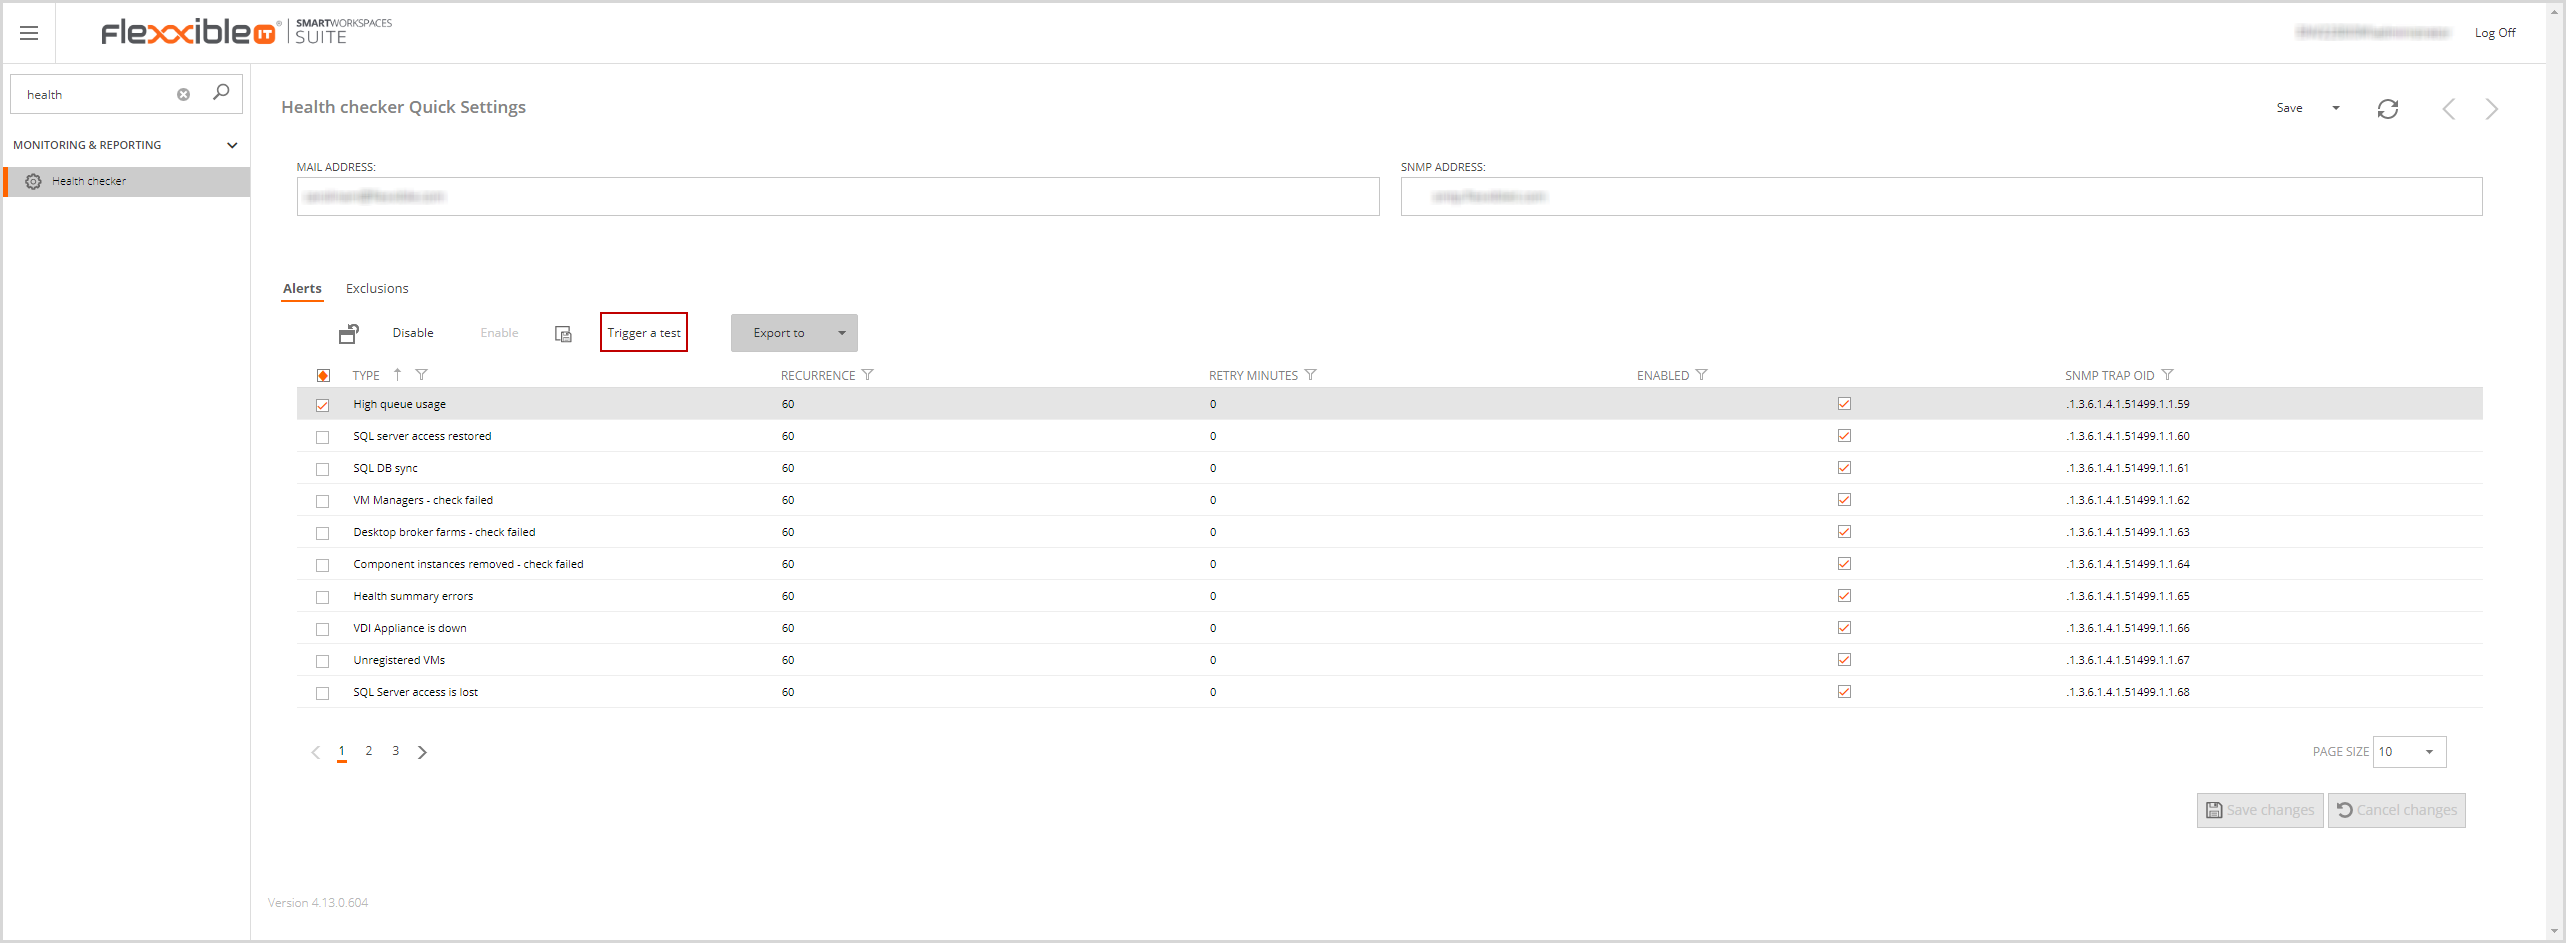
You must select the desired alert or alerts to test and then click on Trigger a test. Then the following modal window is displayed:
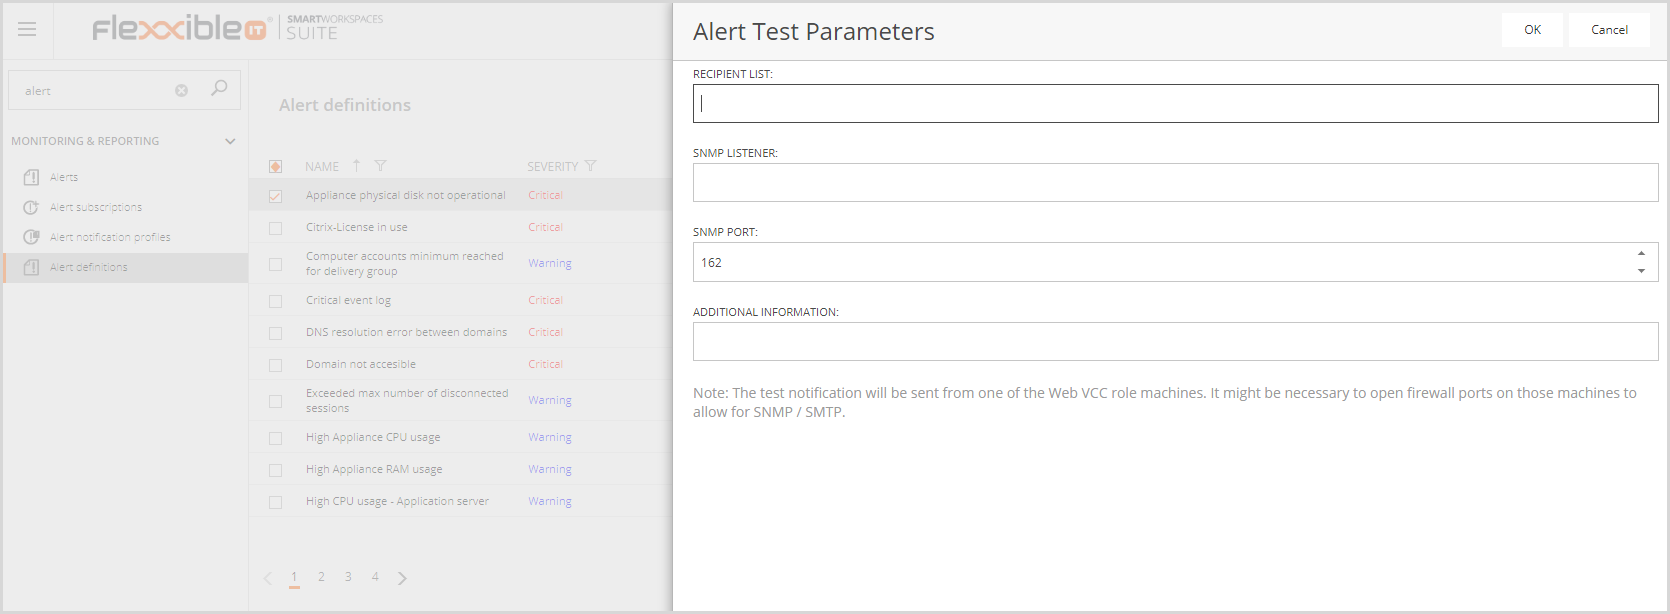
You must fill in at least the recipient list field. Also, you must open firewall ports on the Web VCC roles machines to allow for SNMP/SMTP because the notification will be sent from one of them.
Clicking on OK within a few seconds you will receive the e-mail and (if SNMP listener is configured) the traps.